Fig. 3.
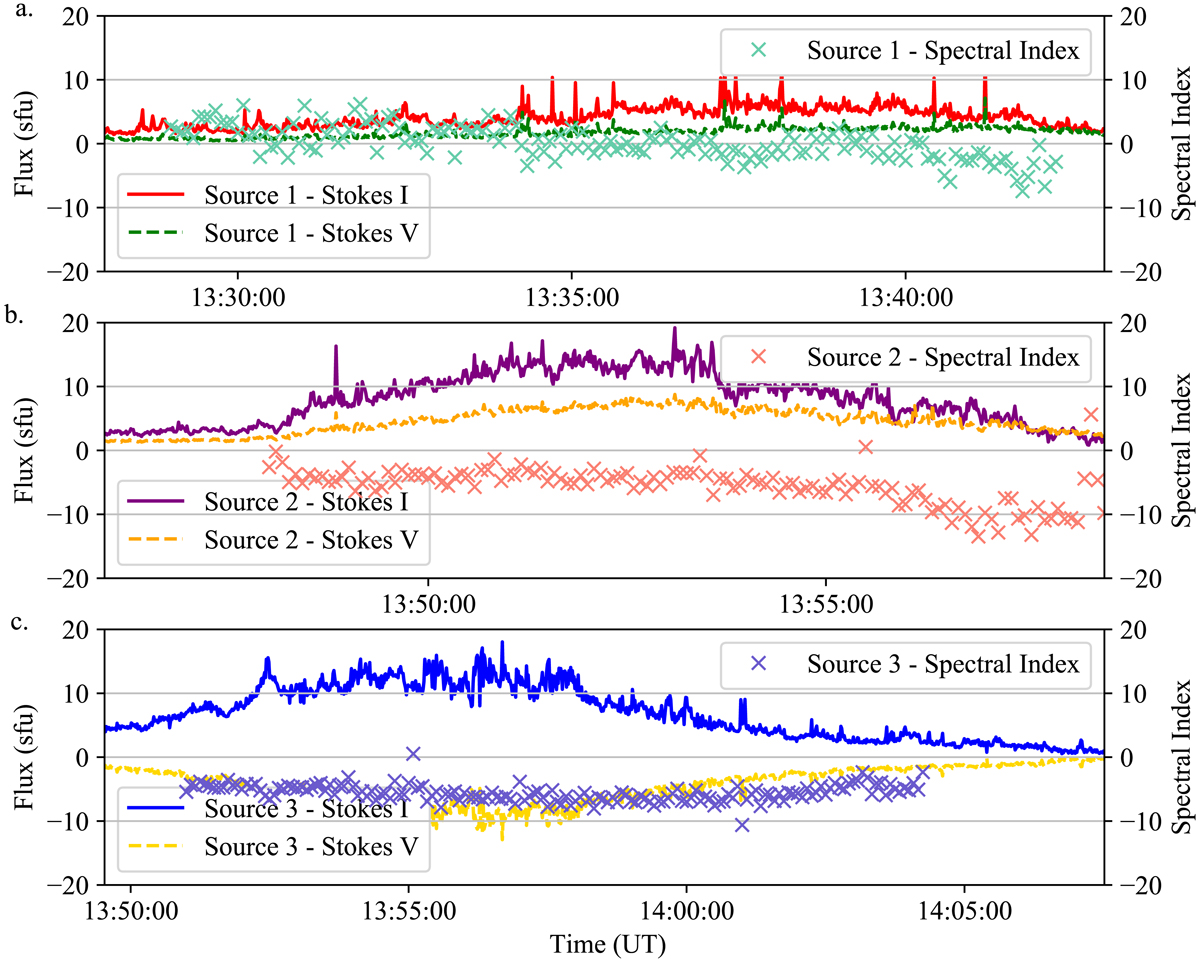
Flux densities and spectral indices of the moving radio sources 1 (panel a), 2 (panel b), and 3 (panel c). The flux densities of the moving radio sources are estimated for both Stokes I (solid lines) and Stokes V (dashed lines) emission in each panel. The spectral indices were estimated by fitting a power-law function to the lower NRH frequencies, where the radio sources are clearly observed in images: 150–228 MHz, 150–173 MHz, and 150–173 MHz, for Sources 1, 2, and 3, respectively.
Current usage metrics show cumulative count of Article Views (full-text article views including HTML views, PDF and ePub downloads, according to the available data) and Abstracts Views on Vision4Press platform.
Data correspond to usage on the plateform after 2015. The current usage metrics is available 48-96 hours after online publication and is updated daily on week days.
Initial download of the metrics may take a while.