Fig. 1.
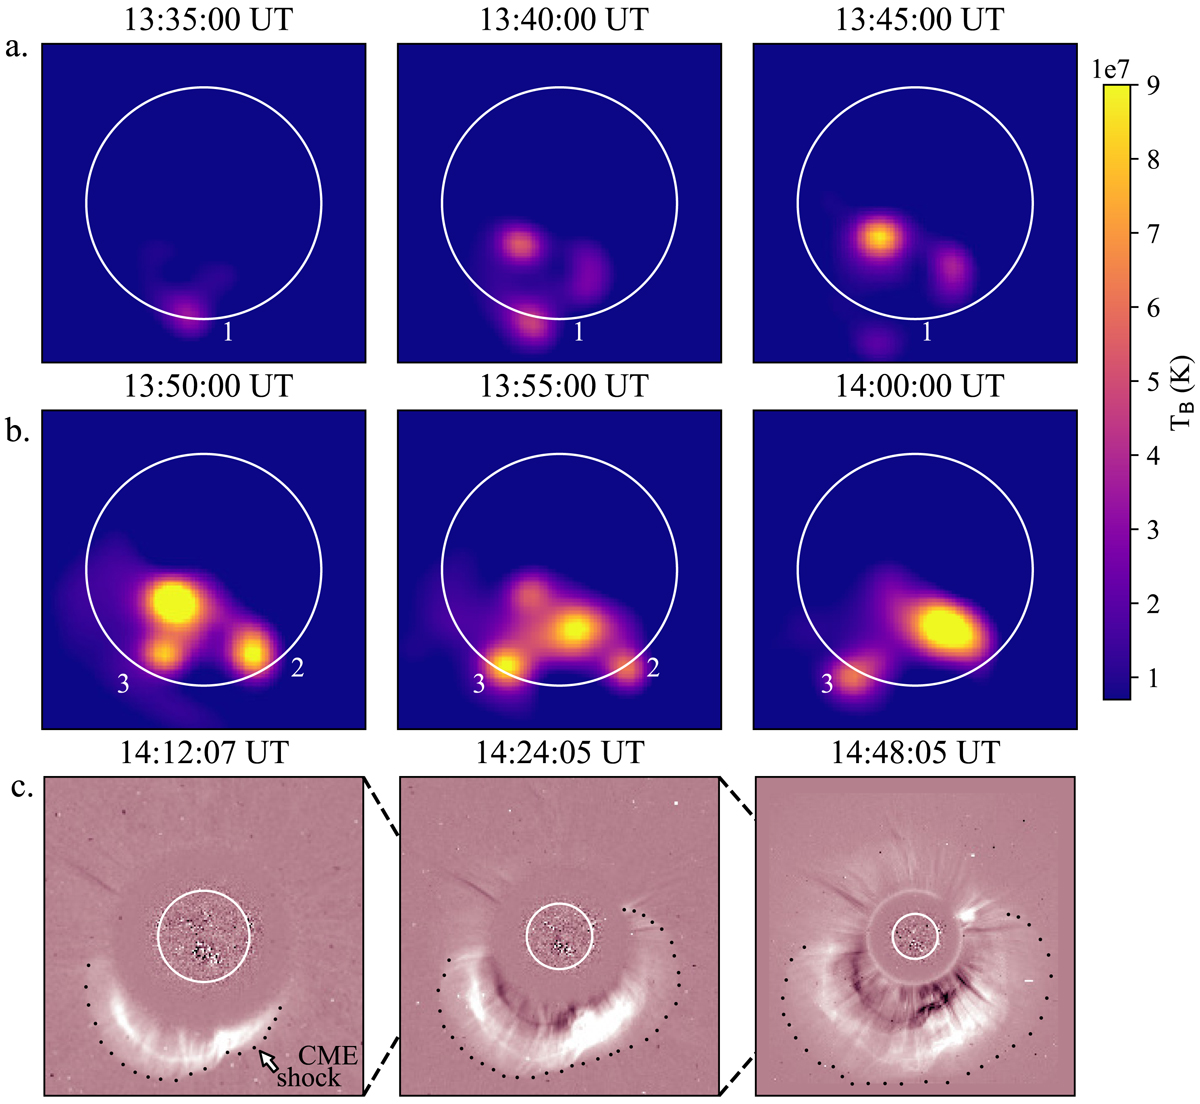
Moving radio bursts associated with the expansion of the 14 June 2012 CME in the solar corona. The radio bursts are shown in panels a and b from 13:35 to 14:00 UT as observed by the NRH at 150 MHz. The white-light signature of the CME becomes visible at a later time (from 14:12 UT), when it expands to the higher corona as observed by the LASCO/C2 coronagraph. The white circles in the images in panel c denote the visible solar limb. The white arrow points towards the CME shock, which is indicated by the fainter outline surrounding the CME. The outer edge of the white-light shock is denoted by the dotted line in panel c. A clear shock is observed in both south-easterly and south-westerly directions. The evolution of the radio bursts through time can be seen in Movies 1 and 2 available online.
Current usage metrics show cumulative count of Article Views (full-text article views including HTML views, PDF and ePub downloads, according to the available data) and Abstracts Views on Vision4Press platform.
Data correspond to usage on the plateform after 2015. The current usage metrics is available 48-96 hours after online publication and is updated daily on week days.
Initial download of the metrics may take a while.