Fig. 4
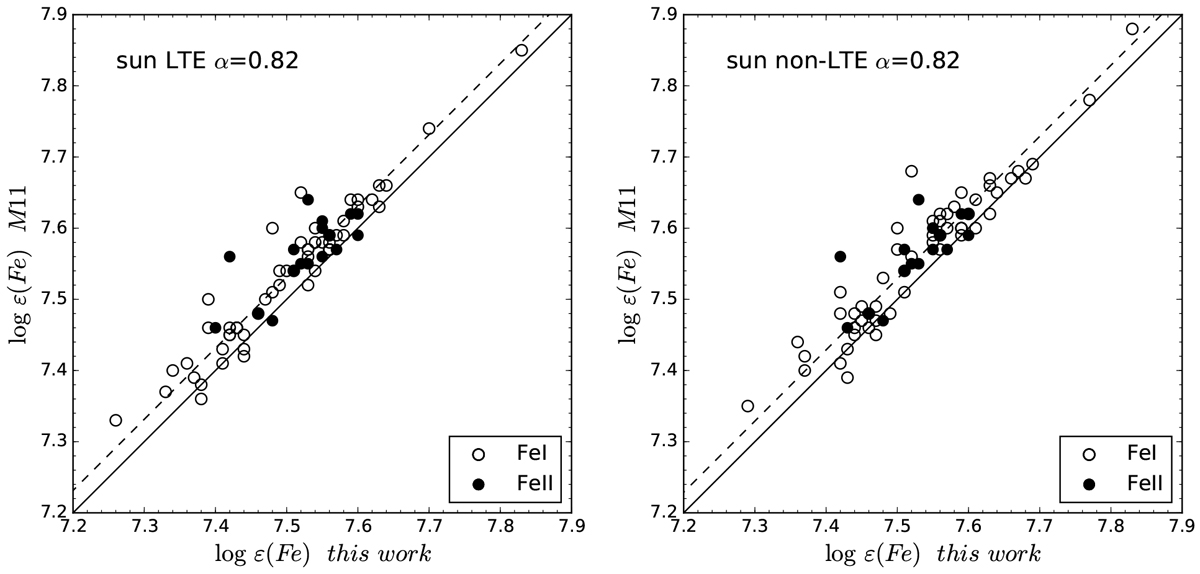
Comparison between our iron abundances and the results derived from M11 under LTE (left panel) and NLTE (right panel) cases. The abundances obtained from Fe I lines are plotted with open circles and Fe II are plotted with filled circles. The dash line shows the Fe I offset from the metallicity 1:1 solid line, which is 0.031 dex under LTE and 0.029 dex under NLTE.
Current usage metrics show cumulative count of Article Views (full-text article views including HTML views, PDF and ePub downloads, according to the available data) and Abstracts Views on Vision4Press platform.
Data correspond to usage on the plateform after 2015. The current usage metrics is available 48-96 hours after online publication and is updated daily on week days.
Initial download of the metrics may take a while.