Fig. 6
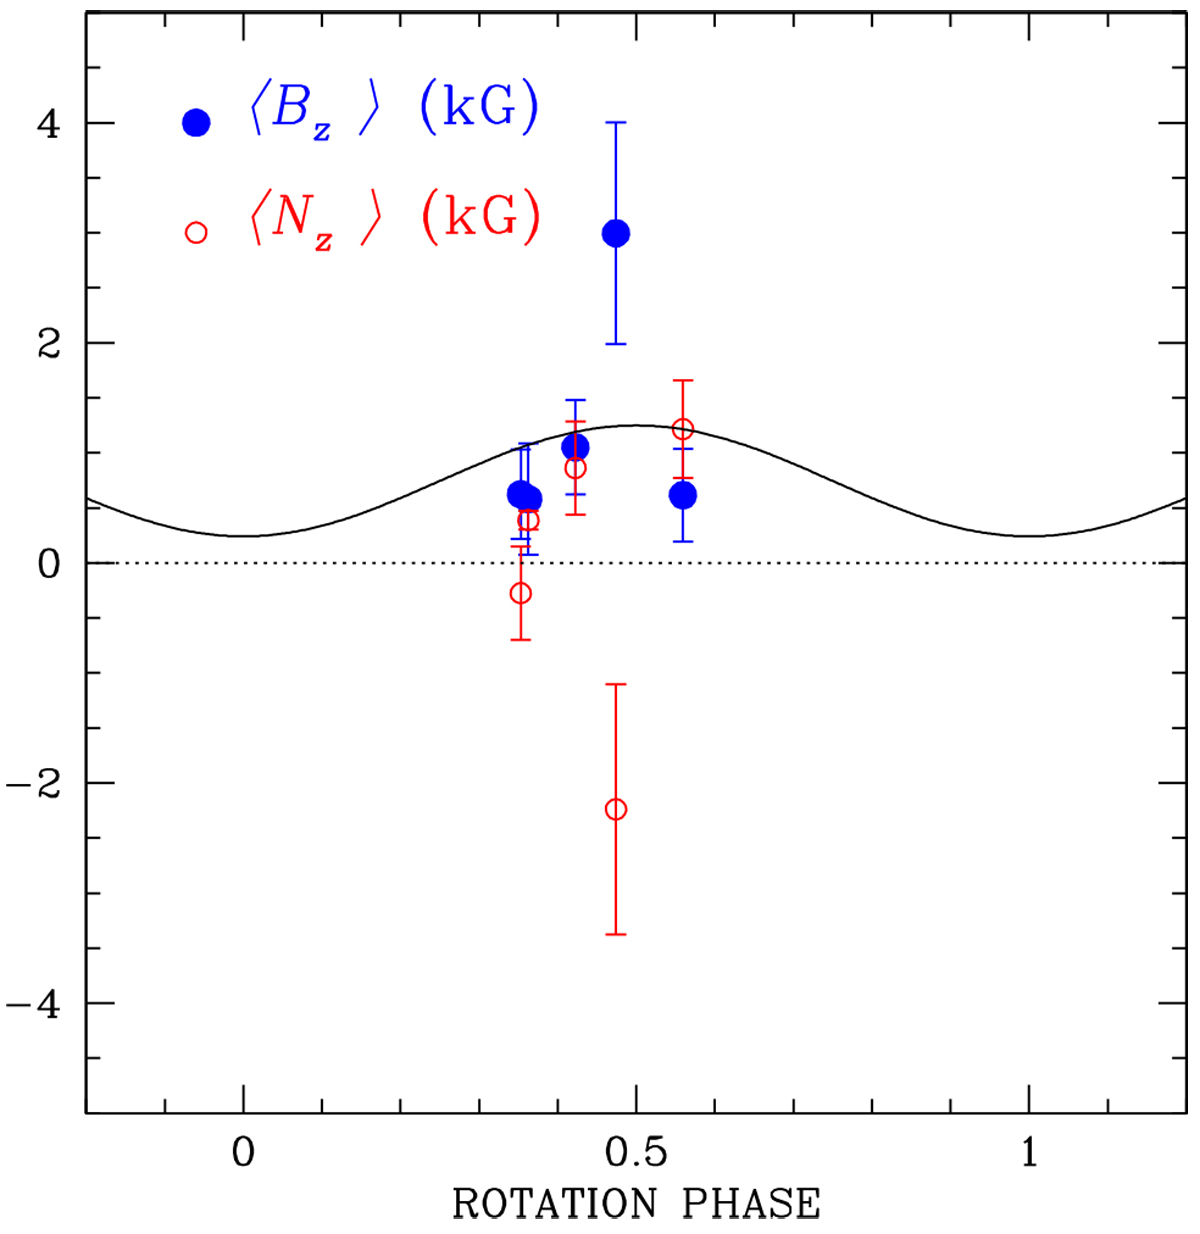
Mean longitudinal field and null field measurements of SMC 159-2 as a function of the rotational phase. Here the rotation phase is defined consistently with the light curves of Fig. 5, which is offset by 0.5 cycles from what is usually adopted for longitudinal field curves (which generally have the maximum at rotation phase zero). The field measurement at rotation phase =0.5 was presented in Paper I. The solid curve shows the prediction of the model by Munoz et al. (2020).
Current usage metrics show cumulative count of Article Views (full-text article views including HTML views, PDF and ePub downloads, according to the available data) and Abstracts Views on Vision4Press platform.
Data correspond to usage on the plateform after 2015. The current usage metrics is available 48-96 hours after online publication and is updated daily on week days.
Initial download of the metrics may take a while.