Free Access
Fig. 3
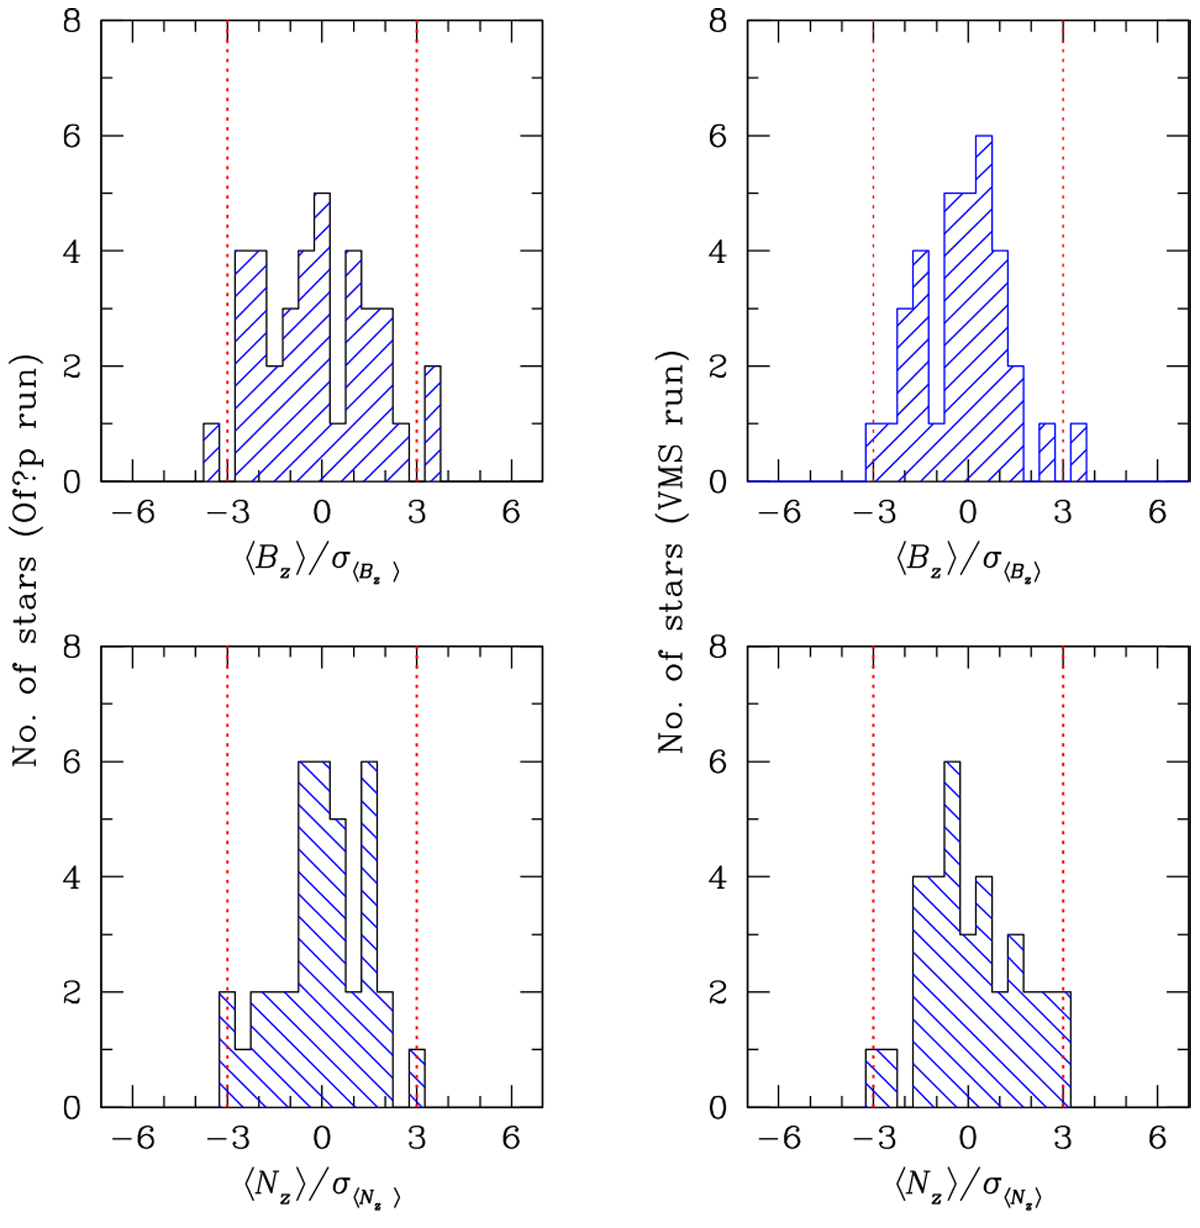
Distribution of ⟨Bz⟩ and ⟨Nz⟩ values normalised to their uncertainties for the stars observed during the run dedicated to Of?p stars (left panels) and for the stars observed during the run dedicated to the VMS stars (right panels). The vertical dotted lines mark the 3− σ limits of these distributions.
Current usage metrics show cumulative count of Article Views (full-text article views including HTML views, PDF and ePub downloads, according to the available data) and Abstracts Views on Vision4Press platform.
Data correspond to usage on the plateform after 2015. The current usage metrics is available 48-96 hours after online publication and is updated daily on week days.
Initial download of the metrics may take a while.