Fig. 6
Download original image
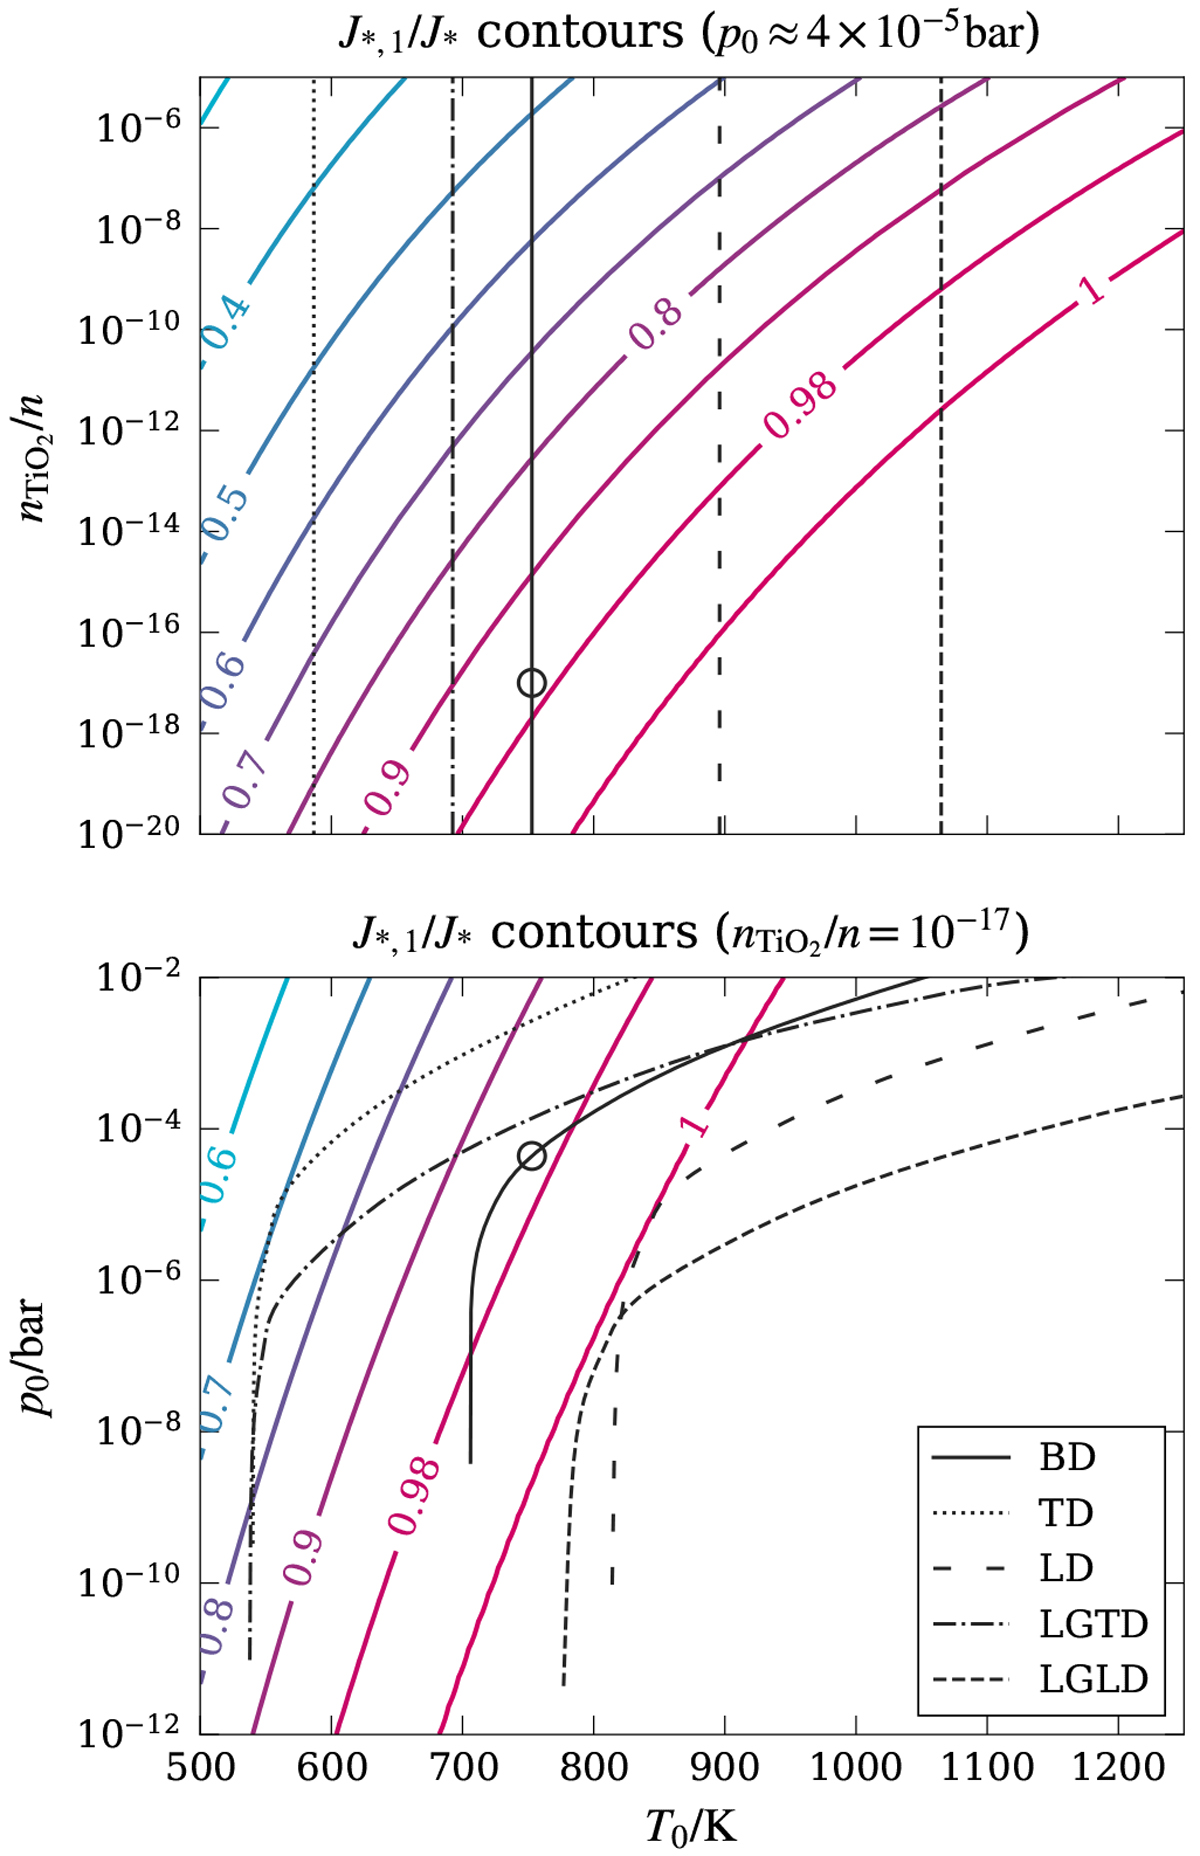
Contour of the change in nucleation rate J*,1 (normalised to the total nucleation rate J*), as a functionof equilibrium temperature T0, ![]() (top panel) and equilibrium gas pressure p0 (bottom panel). The atmospheric profiles for the brown dwarf model used for simulations (BD: Teff = 1500 K, logg = 5.0), as well as typical (LD,TD) and low-gravity (LGLD, LGTD) L and T dwarfs are plotted for context (see model details in Table 2; Fig. 1). The circle on both panels indicate the conditions present in the model used for simulations at the centre of the domain.
(top panel) and equilibrium gas pressure p0 (bottom panel). The atmospheric profiles for the brown dwarf model used for simulations (BD: Teff = 1500 K, logg = 5.0), as well as typical (LD,TD) and low-gravity (LGLD, LGTD) L and T dwarfs are plotted for context (see model details in Table 2; Fig. 1). The circle on both panels indicate the conditions present in the model used for simulations at the centre of the domain.
Current usage metrics show cumulative count of Article Views (full-text article views including HTML views, PDF and ePub downloads, according to the available data) and Abstracts Views on Vision4Press platform.
Data correspond to usage on the plateform after 2015. The current usage metrics is available 48-96 hours after online publication and is updated daily on week days.
Initial download of the metrics may take a while.