Fig. 5
Download original image
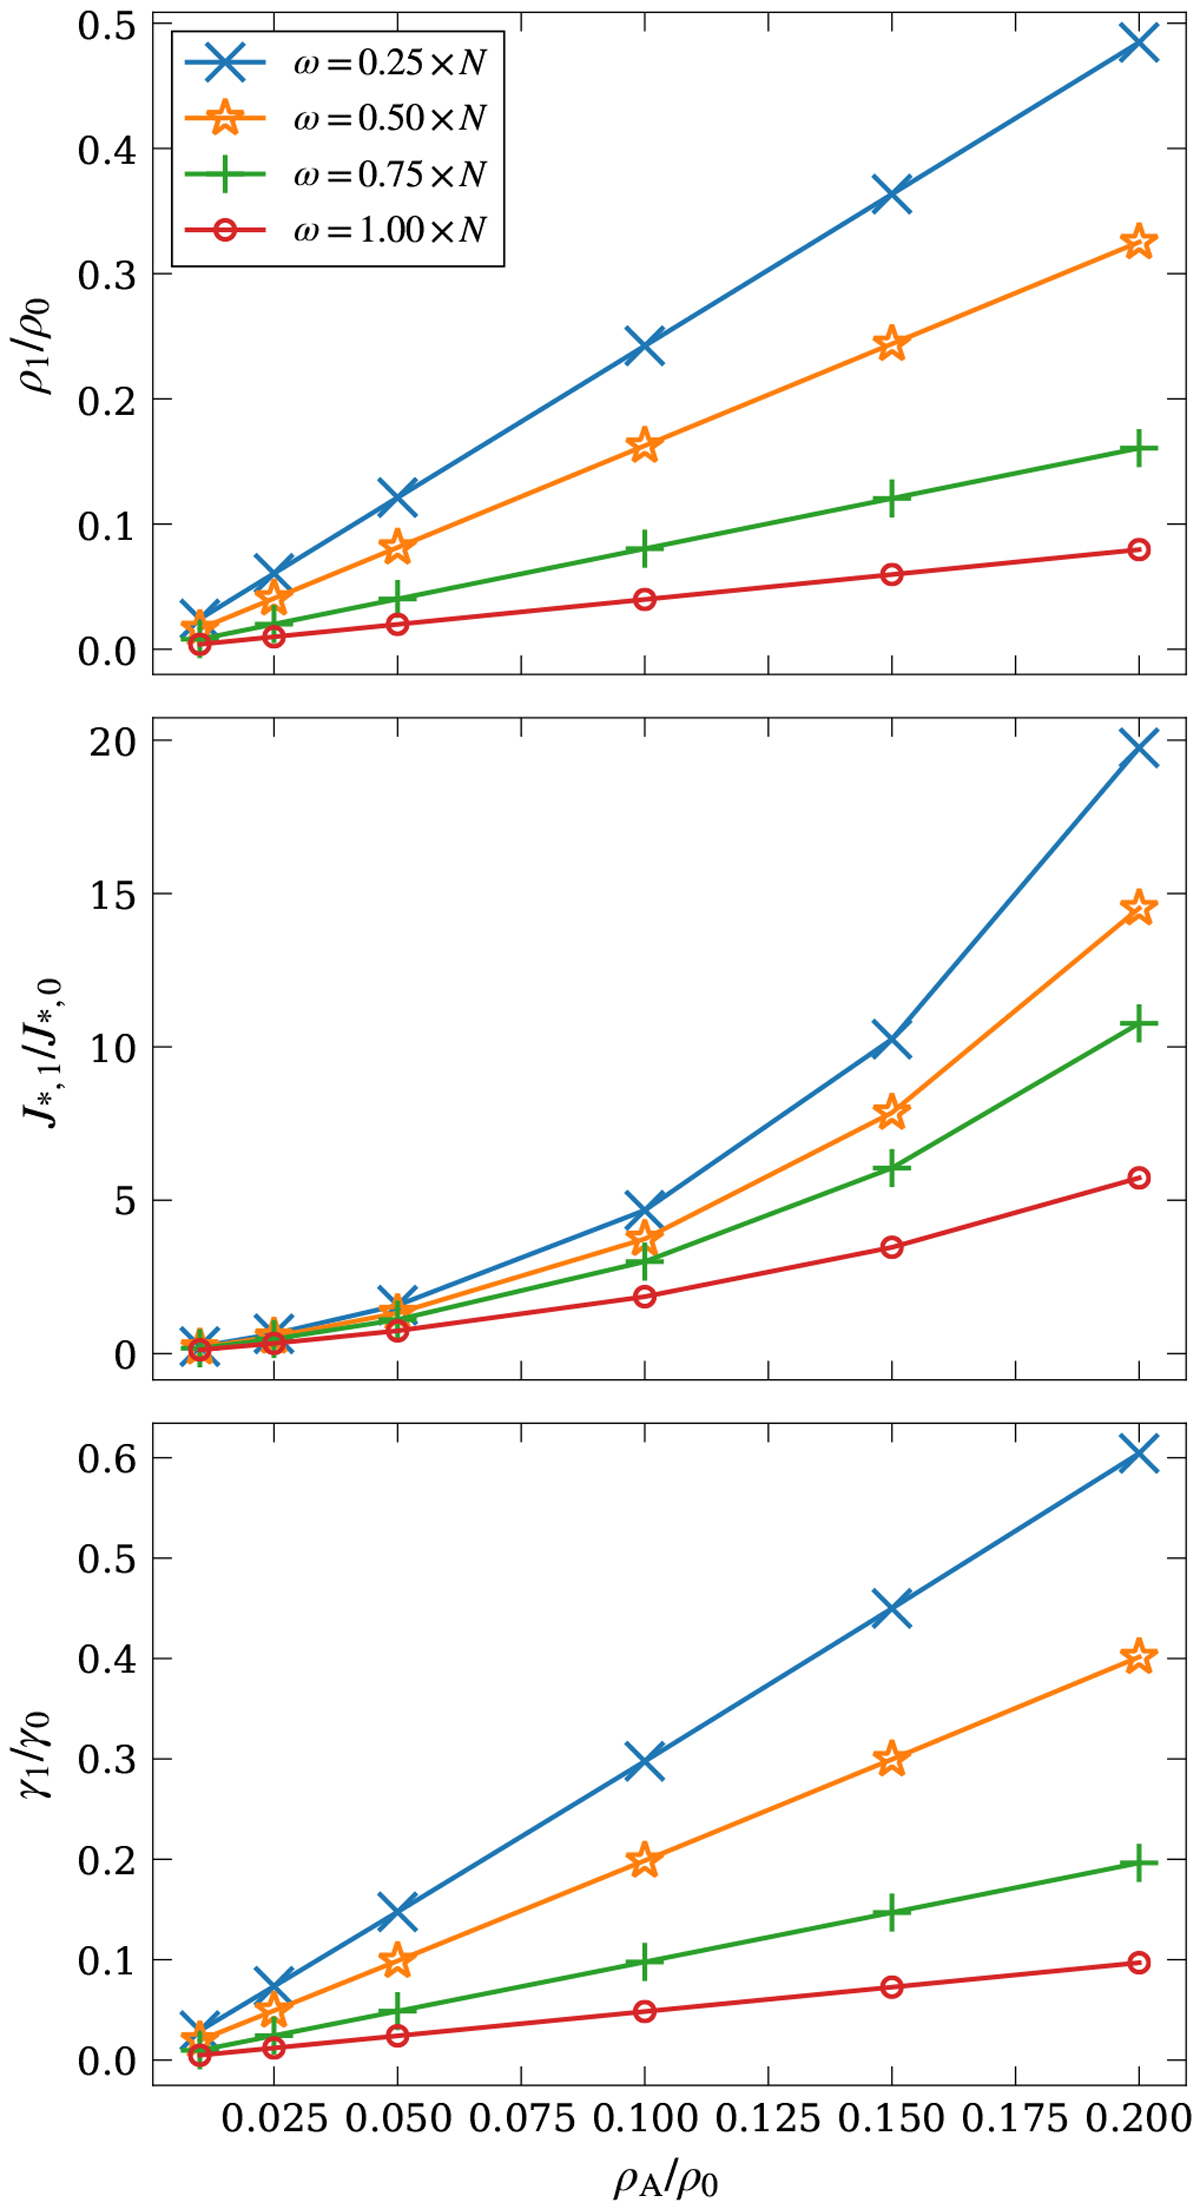
Plots of ρ1∕ρ0 (top panel), J*,1∕J*,0 (middle panel), and γ1∕γ0 (bottom panel) after one period of an internal gravity wave, as a function of the amplitude of the density perturbation used to drive the waves. The nucleation plot shows a strong non-linear increase in response to increased perturbation amplitude, more pronounced with low driving frequencies. The impact on dust growth is much weaker, and growth increases with the driving frequency. The measurements are taken as the maximum values along a vertical slice of the numerical domain, located at a distance X(ω) from the centre of the domain so that X(ω) = Xrefωref∕ω.
Current usage metrics show cumulative count of Article Views (full-text article views including HTML views, PDF and ePub downloads, according to the available data) and Abstracts Views on Vision4Press platform.
Data correspond to usage on the plateform after 2015. The current usage metrics is available 48-96 hours after online publication and is updated daily on week days.
Initial download of the metrics may take a while.