Fig. 4
Download original image
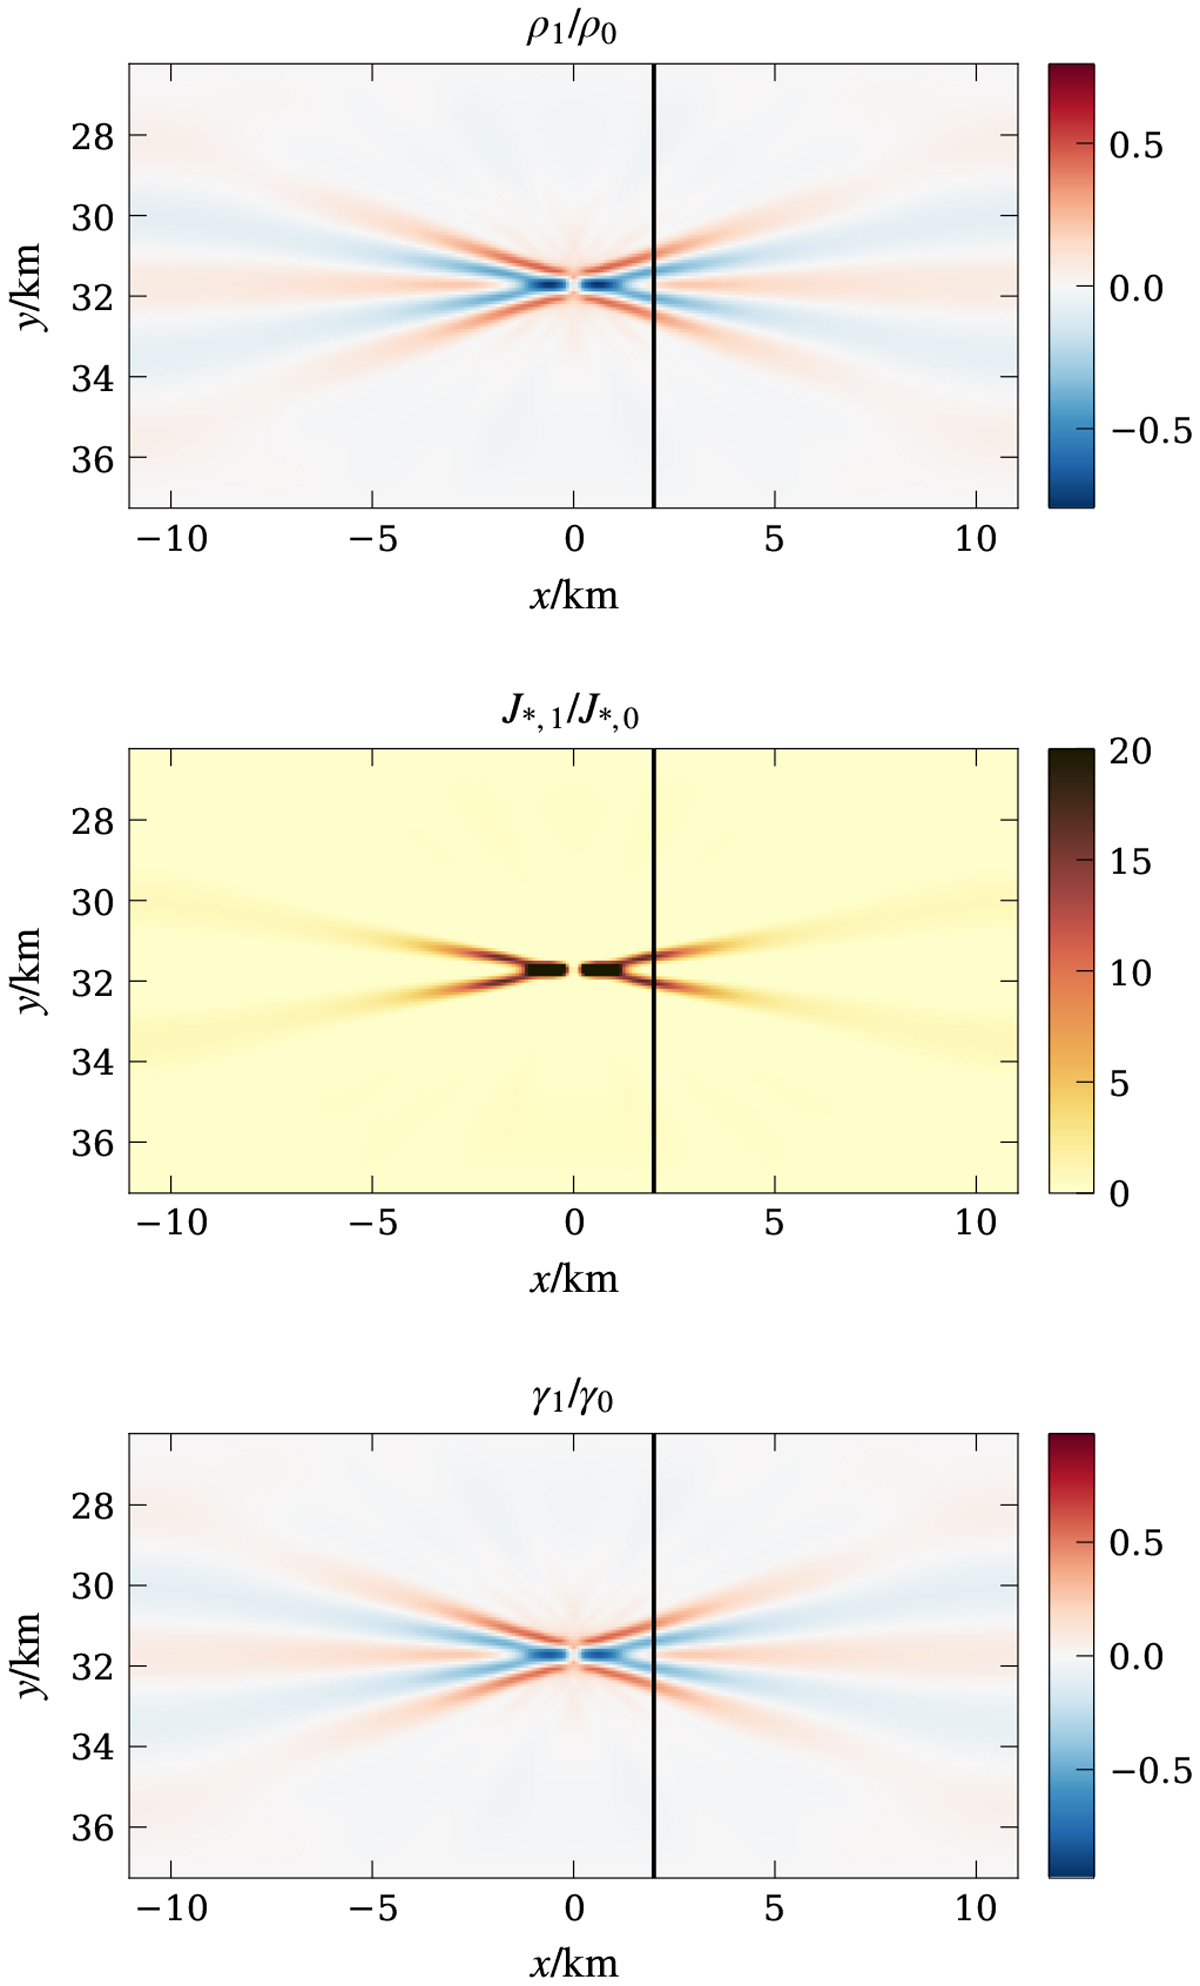
2D map of ρ1∕ρ0 (top panel), J*,1∕J*,0 (middle panel) and γ1∕γ0 (bottom panel) after one oscillation period. For this example, waves are driven at ω = 0.25 N, and the amplitude of the driving perturbation ρA = 0.2 ρ0. The vertical line shows the location of the slice used to measure the wave response, at a distance X(ω) from the centre of the domain so that X(ω) = Xrefωref∕ω.
Current usage metrics show cumulative count of Article Views (full-text article views including HTML views, PDF and ePub downloads, according to the available data) and Abstracts Views on Vision4Press platform.
Data correspond to usage on the plateform after 2015. The current usage metrics is available 48-96 hours after online publication and is updated daily on week days.
Initial download of the metrics may take a while.