Free Access
Fig. 5.
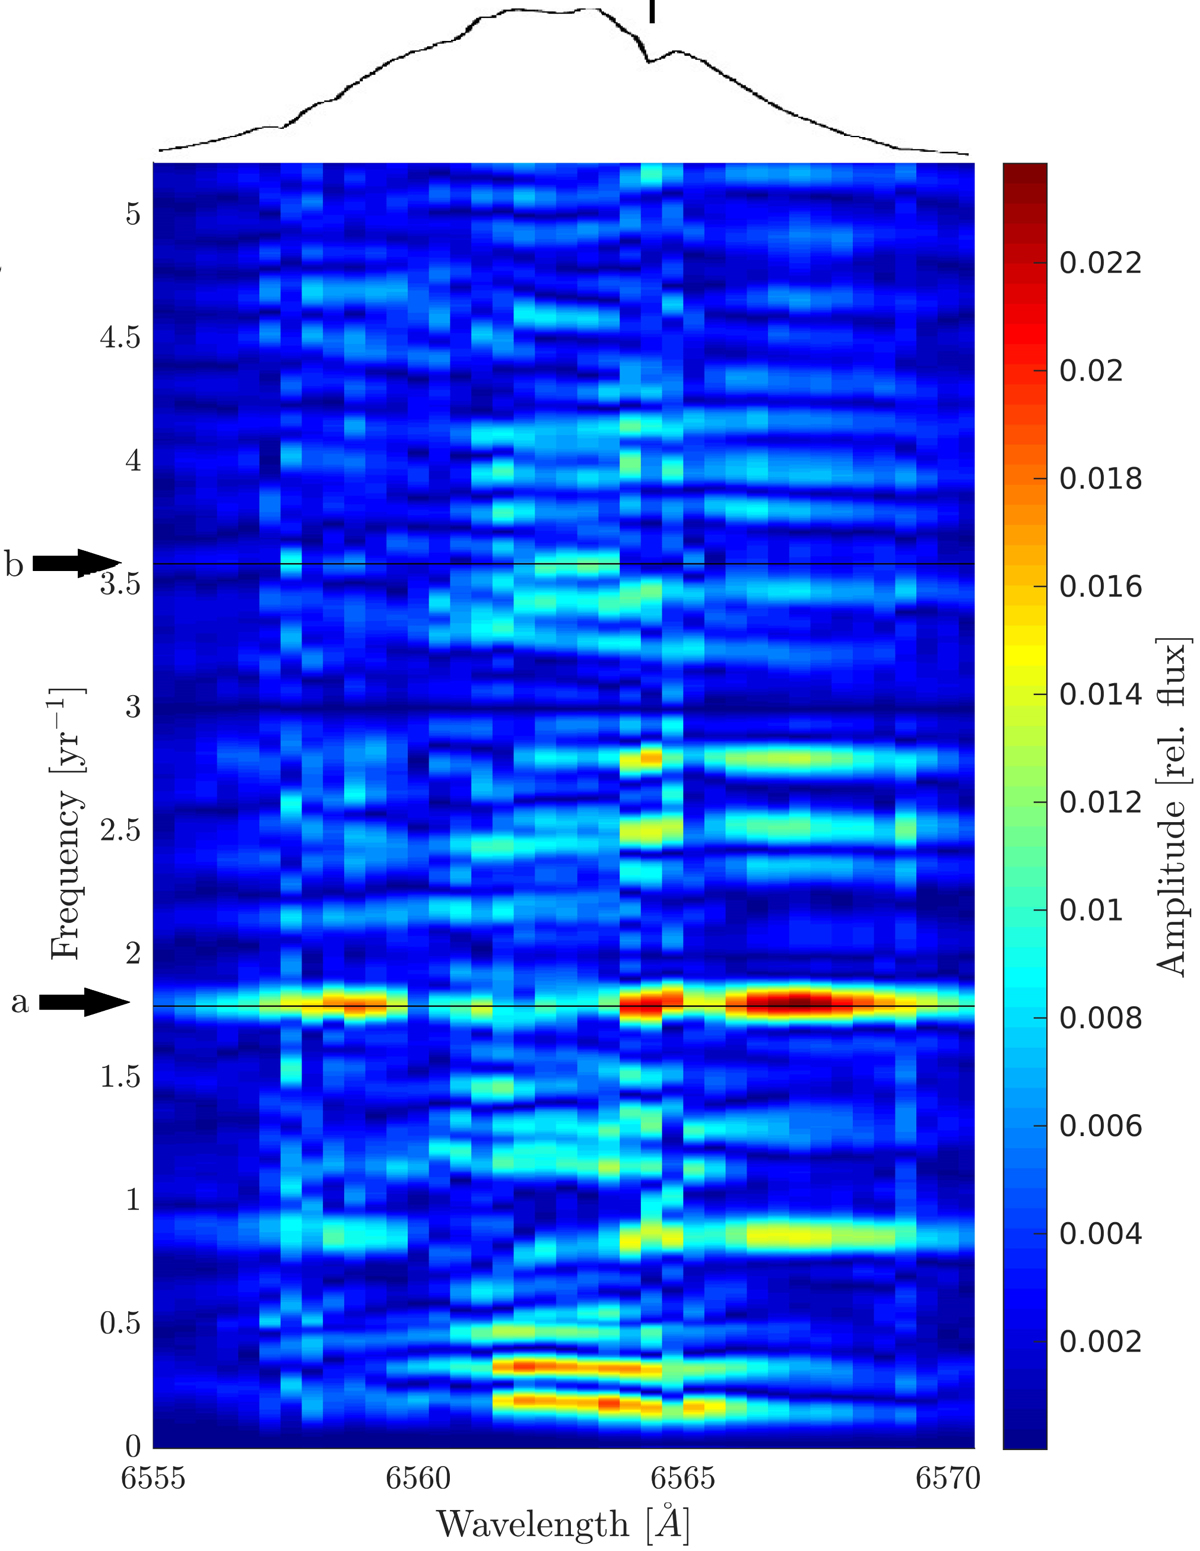
Wavelength-resolved amplitude spectrum for γ Cas across the Hα profile. An example of the Hα profile is shown on top as reference. Arrows mark regions of interest: (a) stellar orbital frequency, (b) twice the stellar orbital frequency. The signature at ∼6564.5 Å (marked on the profile) is caused by telluric contamination.
Current usage metrics show cumulative count of Article Views (full-text article views including HTML views, PDF and ePub downloads, according to the available data) and Abstracts Views on Vision4Press platform.
Data correspond to usage on the plateform after 2015. The current usage metrics is available 48-96 hours after online publication and is updated daily on week days.
Initial download of the metrics may take a while.