Fig. 12.
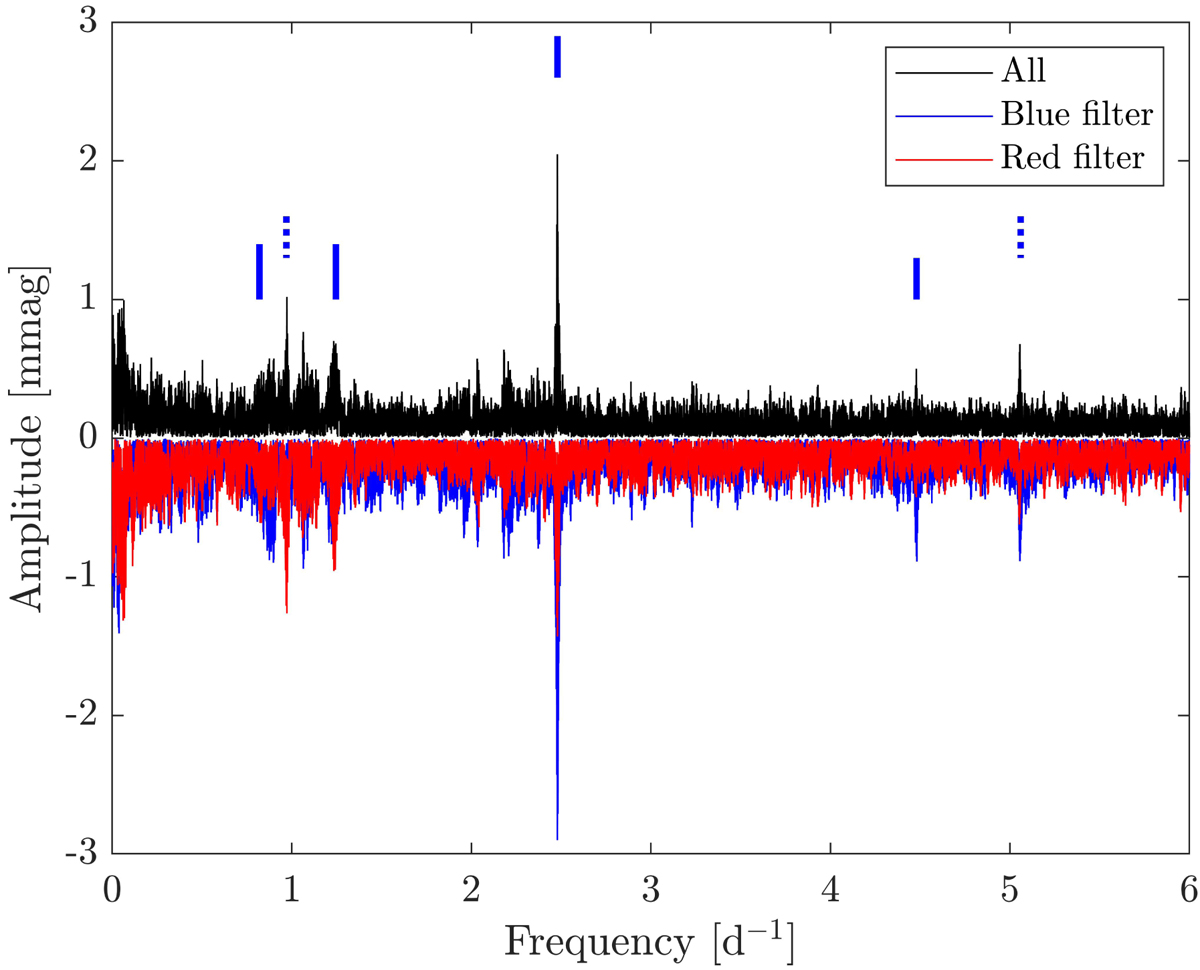
Amplitude spectrum of all BRITE datasets combined in black. Blue and red filter satellite data are also combined separately and plotted with corresponding colours. Blue and red spectra are flipped to negative values for clarity. Vertical full lines indicate 0.82, 1.25, 2.48, and 4.48 d−1 respectively. Dotted lines indicate 0.97 and 5.06 d−1, respectively.
Current usage metrics show cumulative count of Article Views (full-text article views including HTML views, PDF and ePub downloads, according to the available data) and Abstracts Views on Vision4Press platform.
Data correspond to usage on the plateform after 2015. The current usage metrics is available 48-96 hours after online publication and is updated daily on week days.
Initial download of the metrics may take a while.