Free Access
Fig. 5.
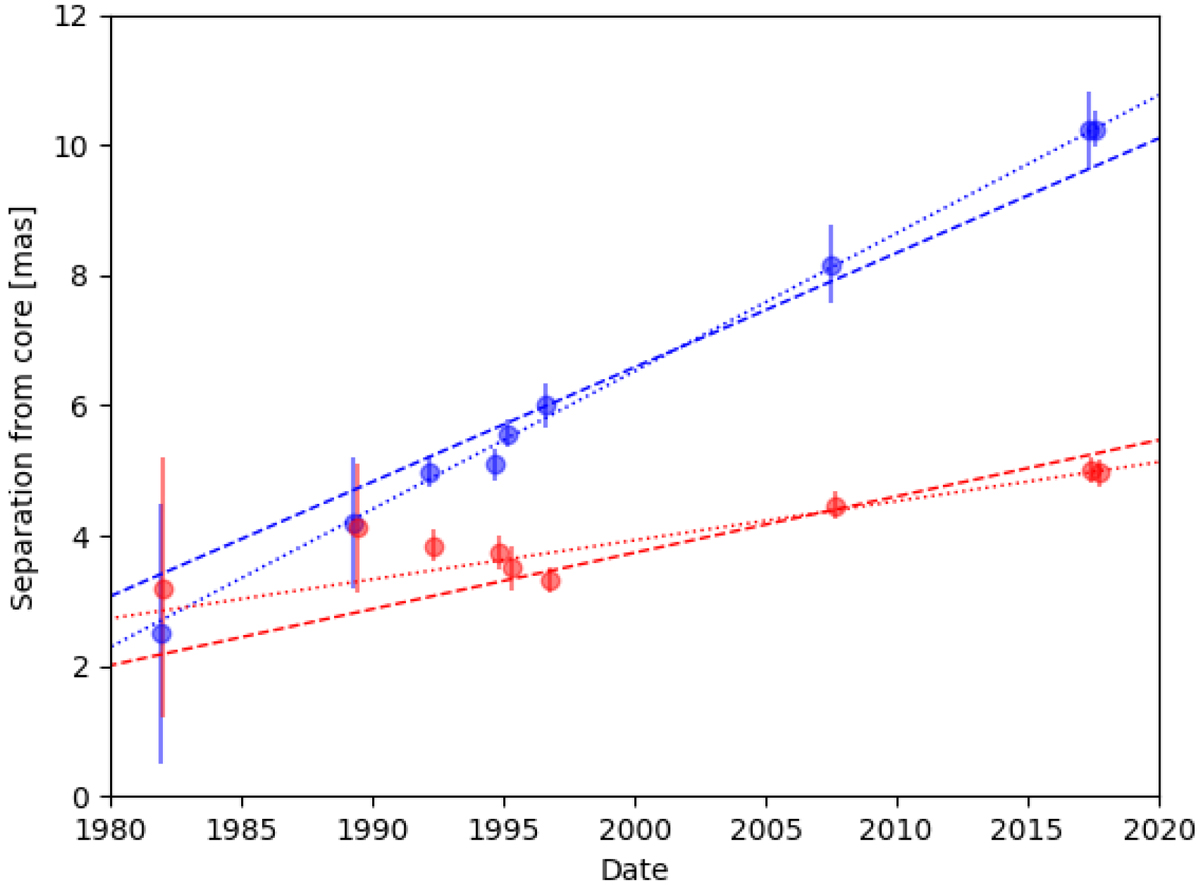
Separation from core for the NW (in blue) and SE (in red) components. For each set of points (see also Table 2), the dotted line shows an unconstrained linear fit to the data, while the dashed line includes the additional condition that the ejection dates of the two components are consistent with each other.
Current usage metrics show cumulative count of Article Views (full-text article views including HTML views, PDF and ePub downloads, according to the available data) and Abstracts Views on Vision4Press platform.
Data correspond to usage on the plateform after 2015. The current usage metrics is available 48-96 hours after online publication and is updated daily on week days.
Initial download of the metrics may take a while.