Fig. 4.
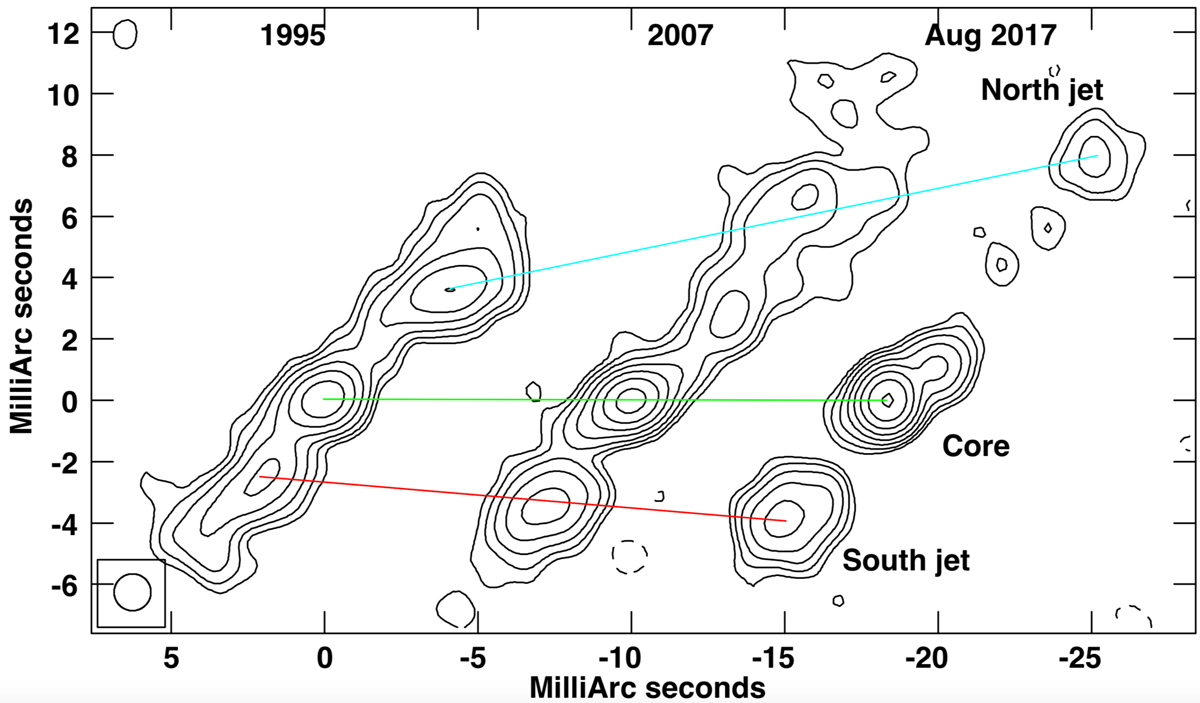
Comparison of three VLBA epochs at 8.4 GHz in 1995, 2007, and August 2017 (left to right). Images are spaced horizontally by a distance proportional to the time separation. Contours are traced at ±(1, 2, 3, 8, 16, …)×1.5 mJy beam−1. The colored lines trace the central position of the NW jet (blue), SE jet (red), and core (green), respectively. All the images are convolved with the same circular beam (shown in the bottom left corner), whose full width at half-maximum is 1.2 mas.
Current usage metrics show cumulative count of Article Views (full-text article views including HTML views, PDF and ePub downloads, according to the available data) and Abstracts Views on Vision4Press platform.
Data correspond to usage on the plateform after 2015. The current usage metrics is available 48-96 hours after online publication and is updated daily on week days.
Initial download of the metrics may take a while.