Fig. 5.
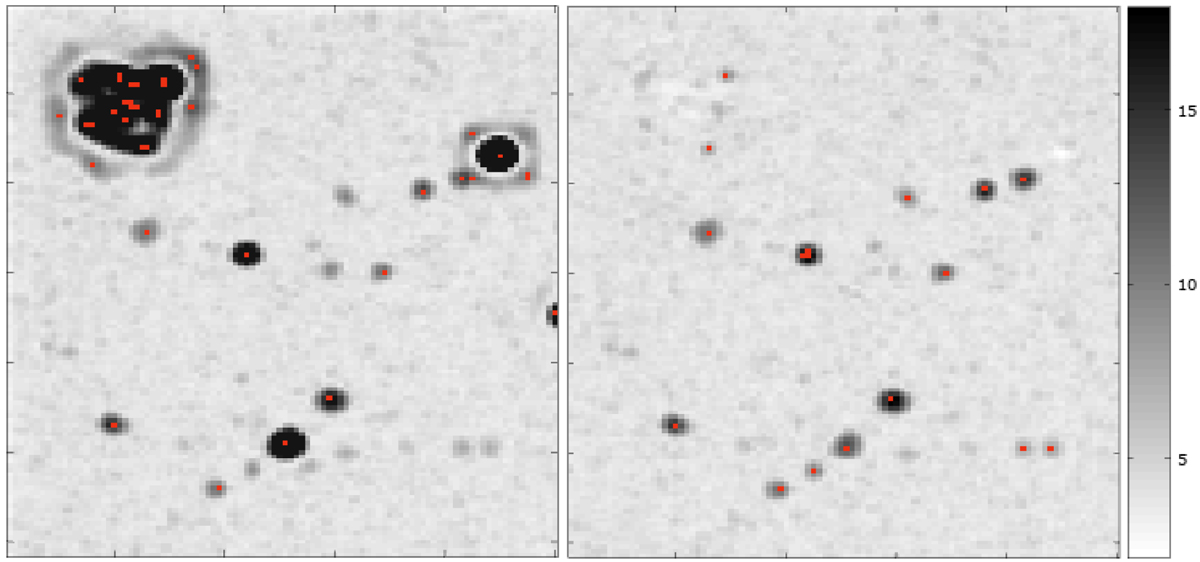
Comparison of two different nuisance removal algorithms on the 100 × 100 top left region of the udf-10 field. Left: median filtering with a window of 144 channels. Right: DCT + PCA. Red: local maxima M+ larger than v = 3σ after the mean (v = 9.4 for the median and v = 6.6 for the DCT+PCA). The grayscale ranges from 0 (white) to 16 (black).
Current usage metrics show cumulative count of Article Views (full-text article views including HTML views, PDF and ePub downloads, according to the available data) and Abstracts Views on Vision4Press platform.
Data correspond to usage on the plateform after 2015. The current usage metrics is available 48-96 hours after online publication and is updated daily on week days.
Initial download of the metrics may take a while.