Open Access
Fig. 3.
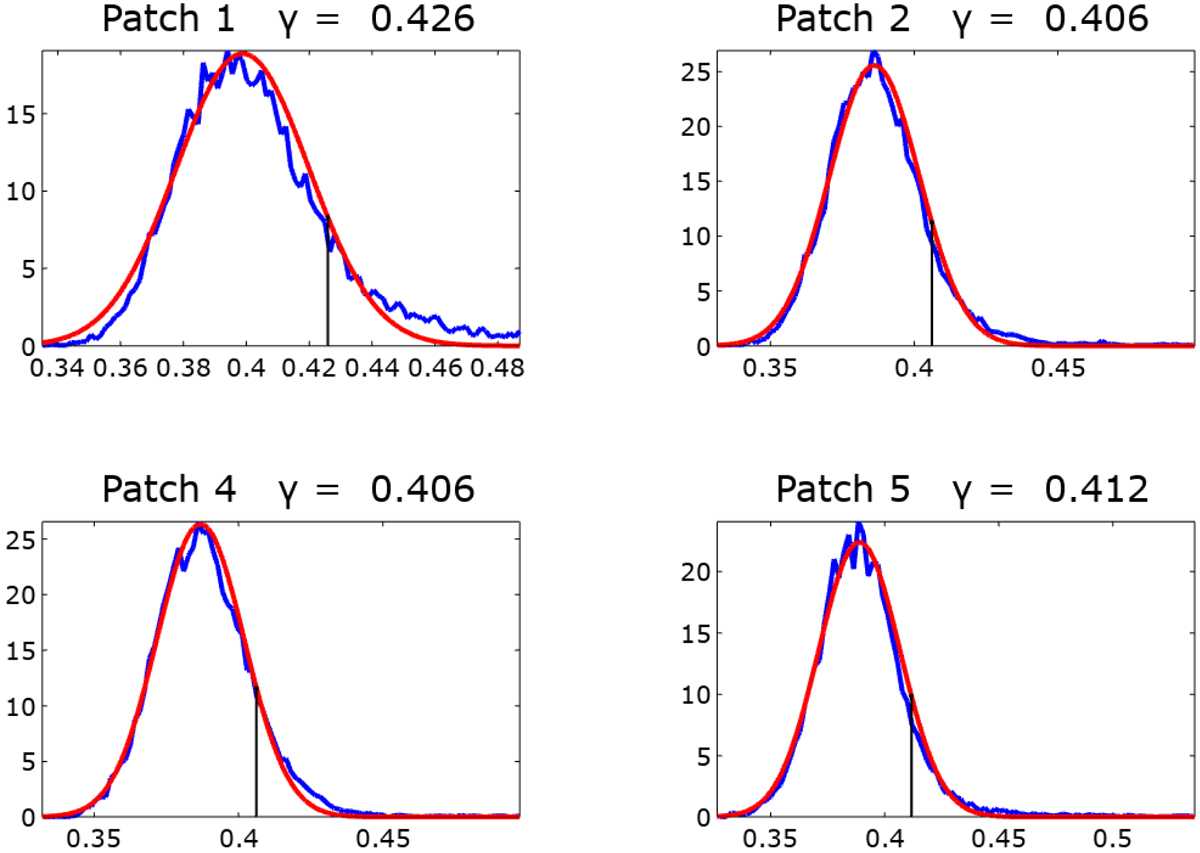
Distribution of the test statistics t2 for four patches of ![]() (blue), Gaussian approximation (red) and thresholds γ(t2) (in the titles and black stems) above which all spectra of the patch are classified as nuisance for
(blue), Gaussian approximation (red) and thresholds γ(t2) (in the titles and black stems) above which all spectra of the patch are classified as nuisance for ![]() . The plots for the five other patches are very similar and not shown.
. The plots for the five other patches are very similar and not shown.
Current usage metrics show cumulative count of Article Views (full-text article views including HTML views, PDF and ePub downloads, according to the available data) and Abstracts Views on Vision4Press platform.
Data correspond to usage on the plateform after 2015. The current usage metrics is available 48-96 hours after online publication and is updated daily on week days.
Initial download of the metrics may take a while.