Open Access
Fig. 2.
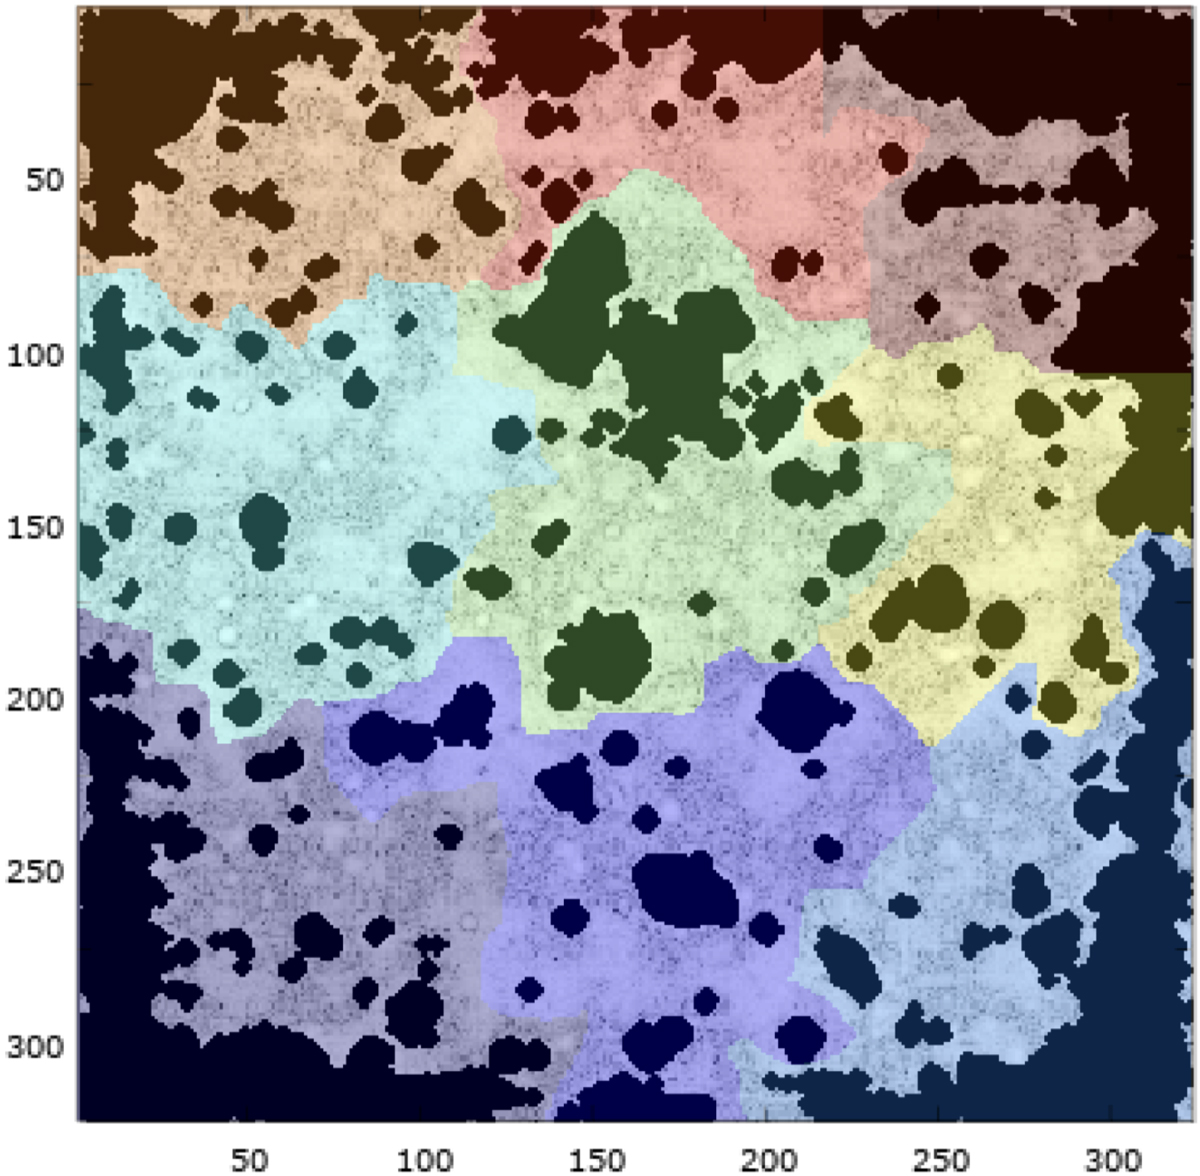
Signal to noise ratio (S/N) image (sum over the wavelength channels of the raw data cube divided by the standard deviation of the noise in each voxel) with, overlaid in black, the zones classified as nuisances by test t1 and t2. The large patches considered for the PCA removal are shown in color.
Current usage metrics show cumulative count of Article Views (full-text article views including HTML views, PDF and ePub downloads, according to the available data) and Abstracts Views on Vision4Press platform.
Data correspond to usage on the plateform after 2015. The current usage metrics is available 48-96 hours after online publication and is updated daily on week days.
Initial download of the metrics may take a while.