Fig. 2.
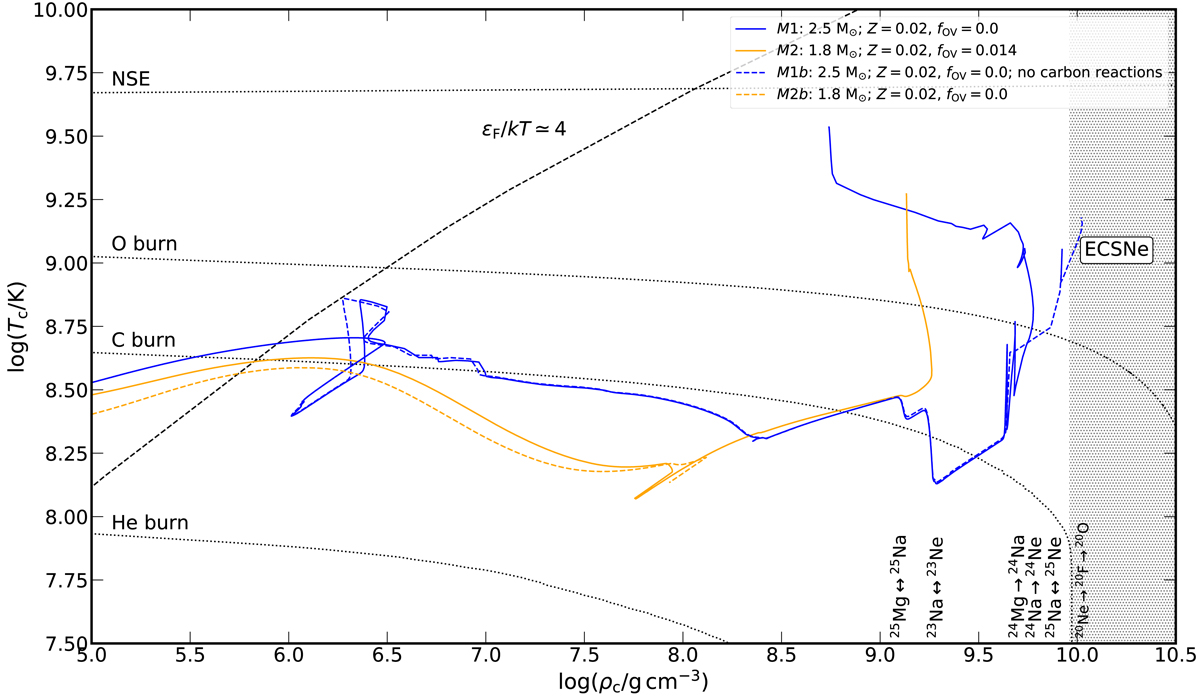
Evolution of the core density and temperature for M1 and M2. The dashed line shows the approximate boundary for electron degeneracy. Burning thresholds for a 100% abundance of the corresponding species are indicated with dotted lines. The NSE threshold assumes an equilibrium timescale of 1 s. In model M1b, the energy contribution of carbon-consuming reactions is set to zero (see text). M2b shows the core evolution of a 1.8 M⊙ without overshooting. While this model stopped at log10(ρc/g cm−3) ≃ 8.2 because of numerical convergence issues, the final core mass is similar to M2.
Current usage metrics show cumulative count of Article Views (full-text article views including HTML views, PDF and ePub downloads, according to the available data) and Abstracts Views on Vision4Press platform.
Data correspond to usage on the plateform after 2015. The current usage metrics is available 48-96 hours after online publication and is updated daily on week days.
Initial download of the metrics may take a while.