Fig. B.1.
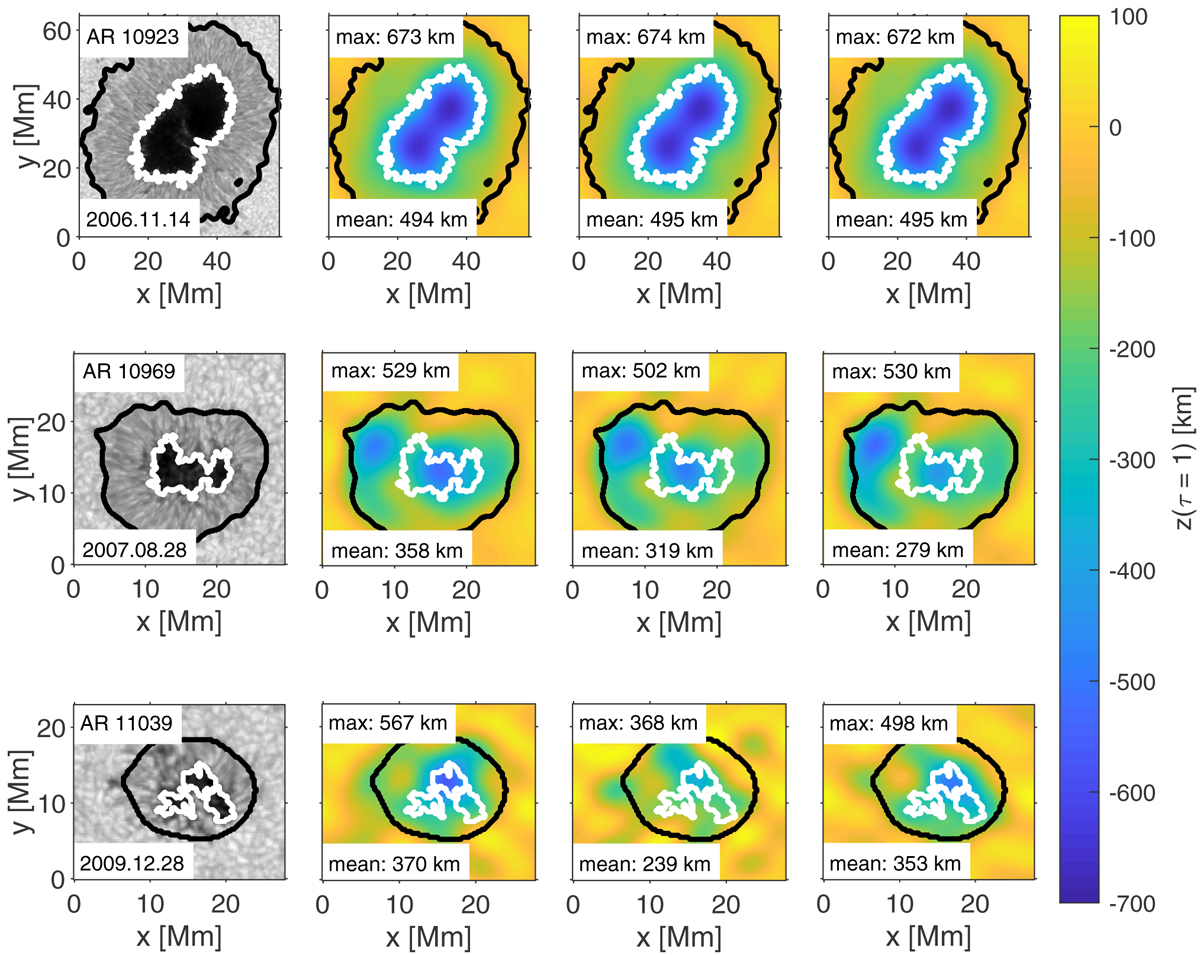
Comparison of maps of the geometric height of the log τ = 0 layer for selected sunspots inferred using the divergence method from inverted Stokes profiles with and without additional scattered light. From left to right: continuum intensity, zW without additional scattered light, zW for additional scattered light with a magnitude of 1% of the mean intensity of the quiet Sun, and zW for additional scattered light with a magnitude of 2% of the mean intensity of the quiet Sun. The white and black contours indicate the inner and outer penumbral boundaries, respectively. The numbers give the maximum Wilson depression and its mean over the umbra.
Current usage metrics show cumulative count of Article Views (full-text article views including HTML views, PDF and ePub downloads, according to the available data) and Abstracts Views on Vision4Press platform.
Data correspond to usage on the plateform after 2015. The current usage metrics is available 48-96 hours after online publication and is updated daily on week days.
Initial download of the metrics may take a while.