Fig. A.1.
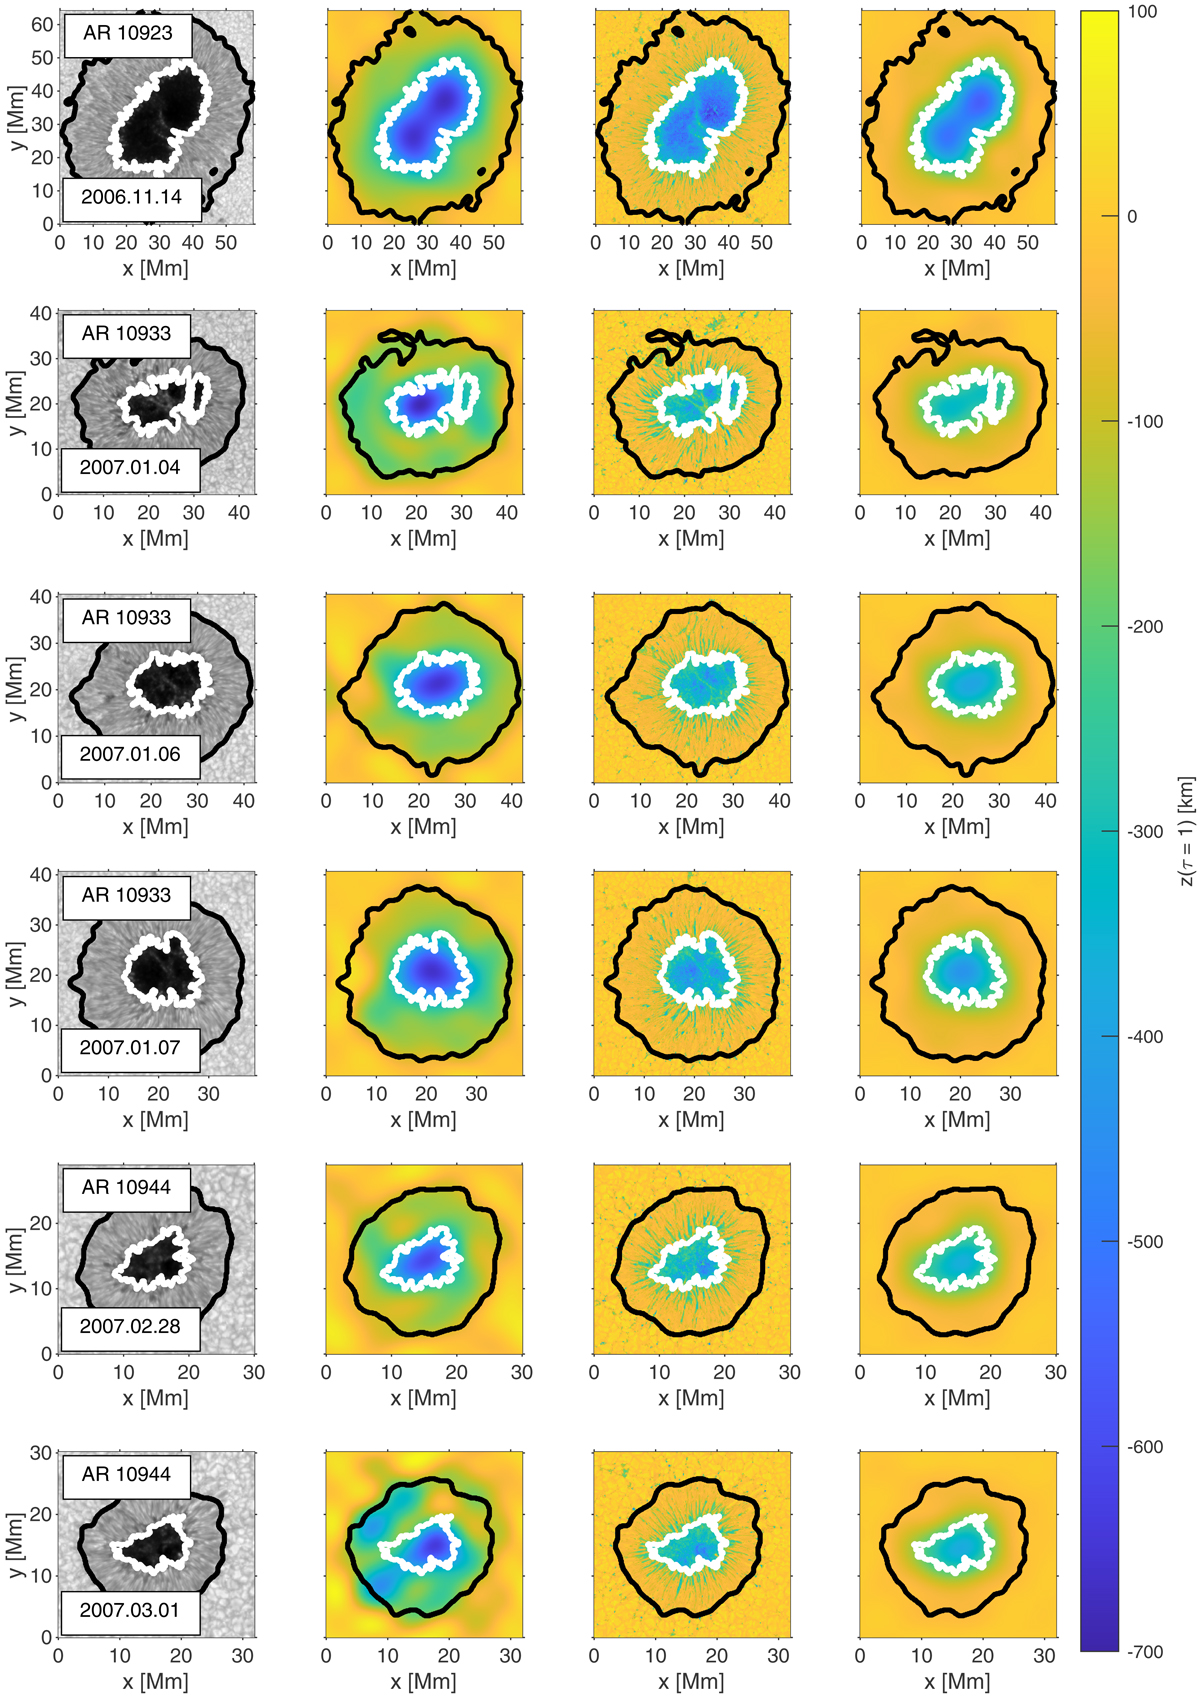
Maps of the continuum intensity and of the derived geometric height of the log τ = 0 layer across the spots analyzed in this study (i.e., the Wilson depression, zW). From left to right: continuum intensity, zW derived from the divergence method, zW derived from the pressure method, and zW derived from the pressure method degraded to the spatial resolution of the divergence method. The white and black contours indicate the inner and outer penumbral boundaries, respectively.
Current usage metrics show cumulative count of Article Views (full-text article views including HTML views, PDF and ePub downloads, according to the available data) and Abstracts Views on Vision4Press platform.
Data correspond to usage on the plateform after 2015. The current usage metrics is available 48-96 hours after online publication and is updated daily on week days.
Initial download of the metrics may take a while.