Fig. 2.
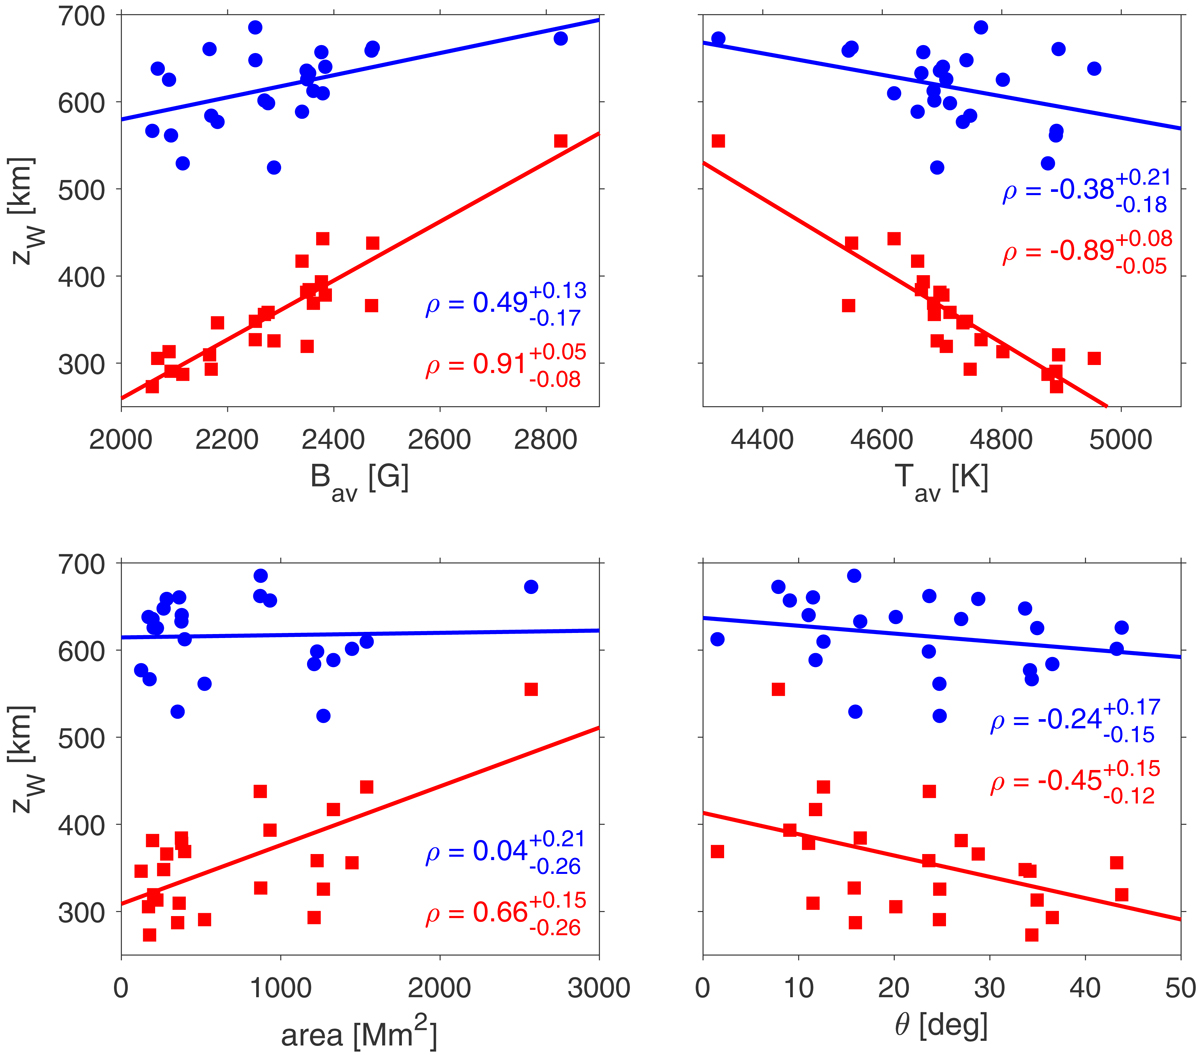
Dependence of the maximum value of the Wilson depression zW on various parameters of the studied sunspots. The blue circles represent the Wilson depression derived using the divergence method while the red squares depict the results from the pressure method. The solid lines indicate linear fits to the Wilson depressions. Also shown are the correlation coefficients between the Wilson depression the respective parameters of the sunspot as well as their 1σ confidence intervals. The correlation coefficients associated with the zW derived with a given method are indicated by the corresponding color. We note that the Wilson depression inferred from the divergence method has an error of about 100 km resulting from uncertainties of the inversion. The various parameters of the sunspots are explained in more detail in the text.
Current usage metrics show cumulative count of Article Views (full-text article views including HTML views, PDF and ePub downloads, according to the available data) and Abstracts Views on Vision4Press platform.
Data correspond to usage on the plateform after 2015. The current usage metrics is available 48-96 hours after online publication and is updated daily on week days.
Initial download of the metrics may take a while.