Fig. 7.
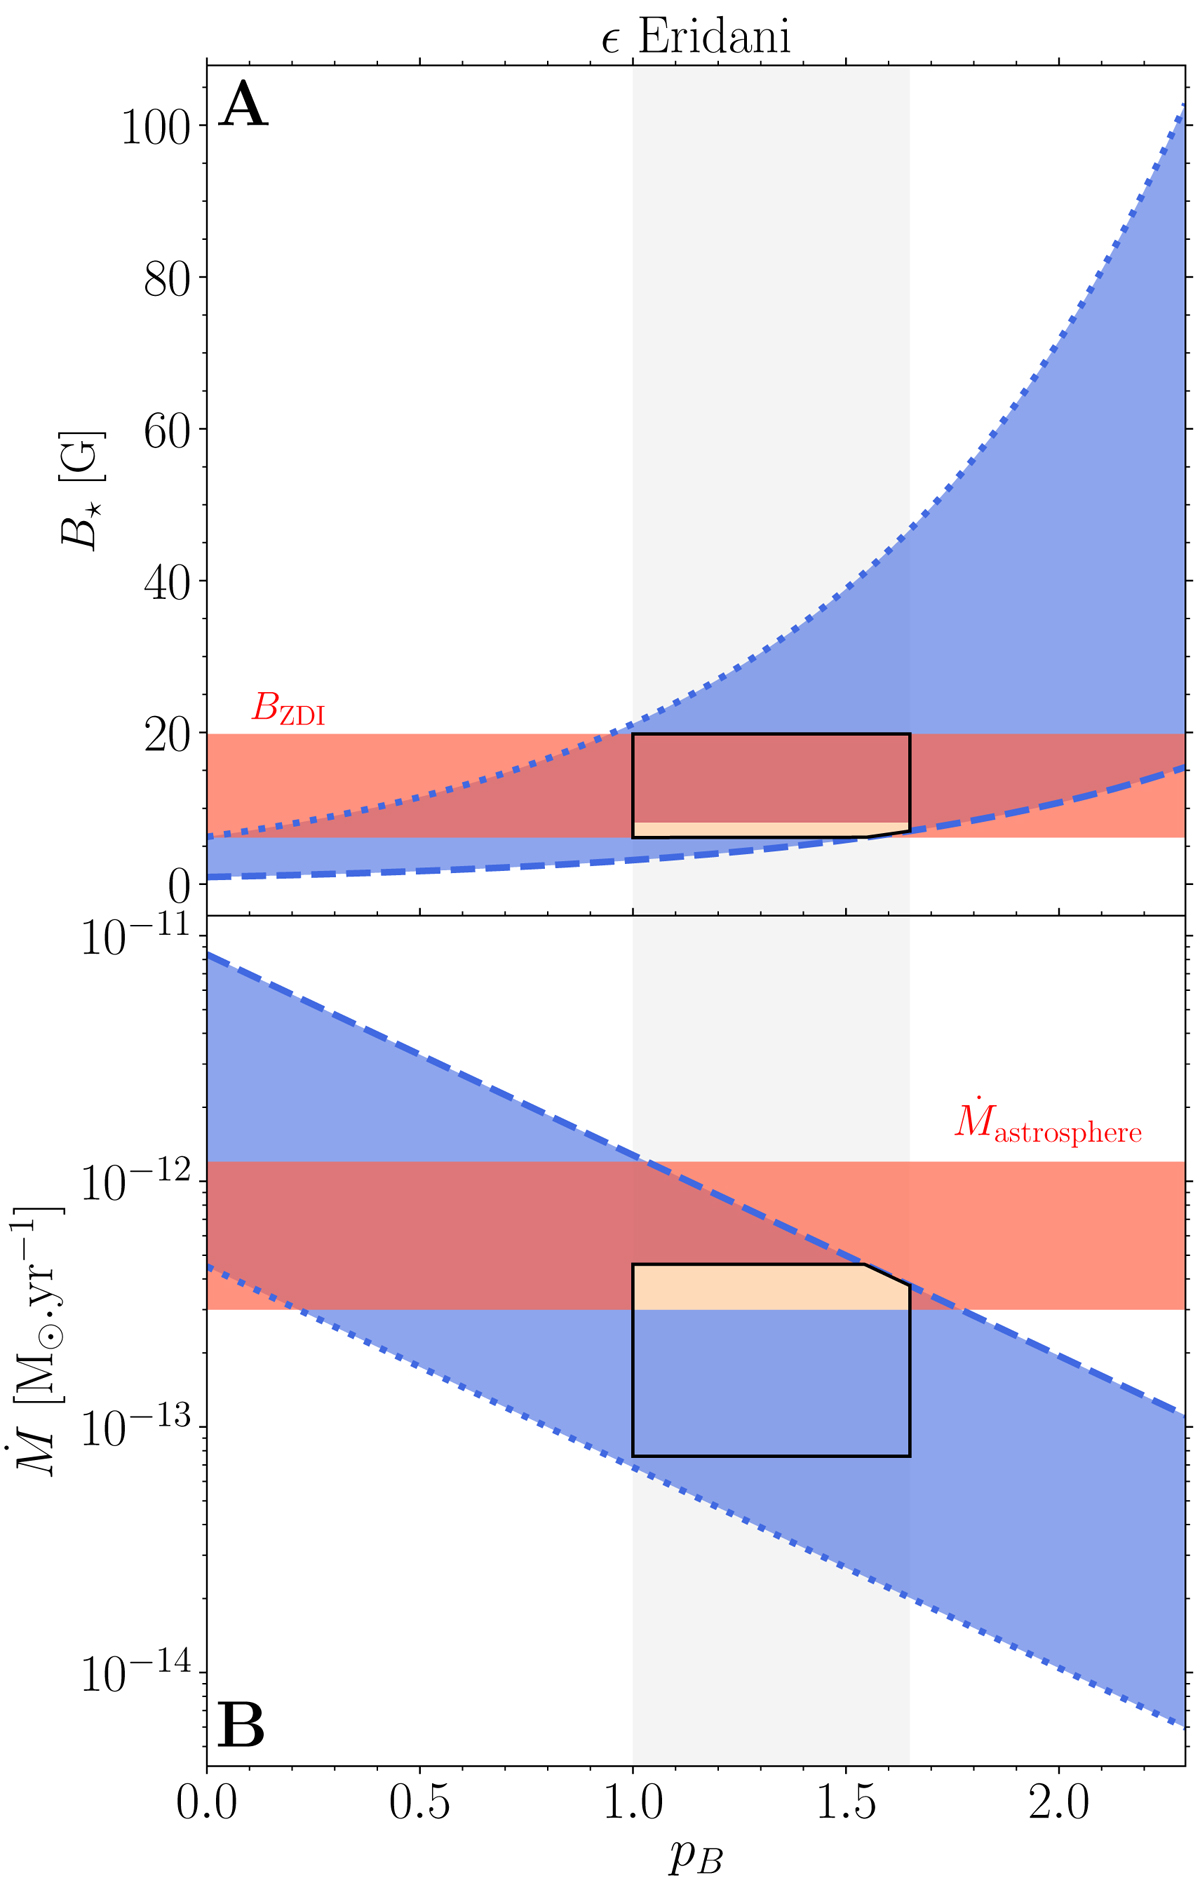
Panel A: estimate of B⋆ for ϵ Eridani as a function of pB. Panel B: estimate of Ṁ as a function of pB. In blue: predictions of our prescriptions. Dashed blue lines: normalizations corresponding to B⊙ = 0.6 G. Dotted blue lines: normalizations corresponding to B⊙ = 4 G. Red bands: observational constraints on the dipolar component of the magnetic field (Jeffers et al. 2014; See et al. 2017) and the mass-loss rate (Wood et al. 2002). The light gray band corresponds to the upper and lower bounds of pB from a large sample of ZDI studies. The black contours delimit the region of B⋆ and Ṁ, which is consistent with statistical ZDI studies and individual measurements of the large-scale magnetic field. In beige: estimates consistent with all of the constraints considered.
Current usage metrics show cumulative count of Article Views (full-text article views including HTML views, PDF and ePub downloads, according to the available data) and Abstracts Views on Vision4Press platform.
Data correspond to usage on the plateform after 2015. The current usage metrics is available 48-96 hours after online publication and is updated daily on week days.
Initial download of the metrics may take a while.