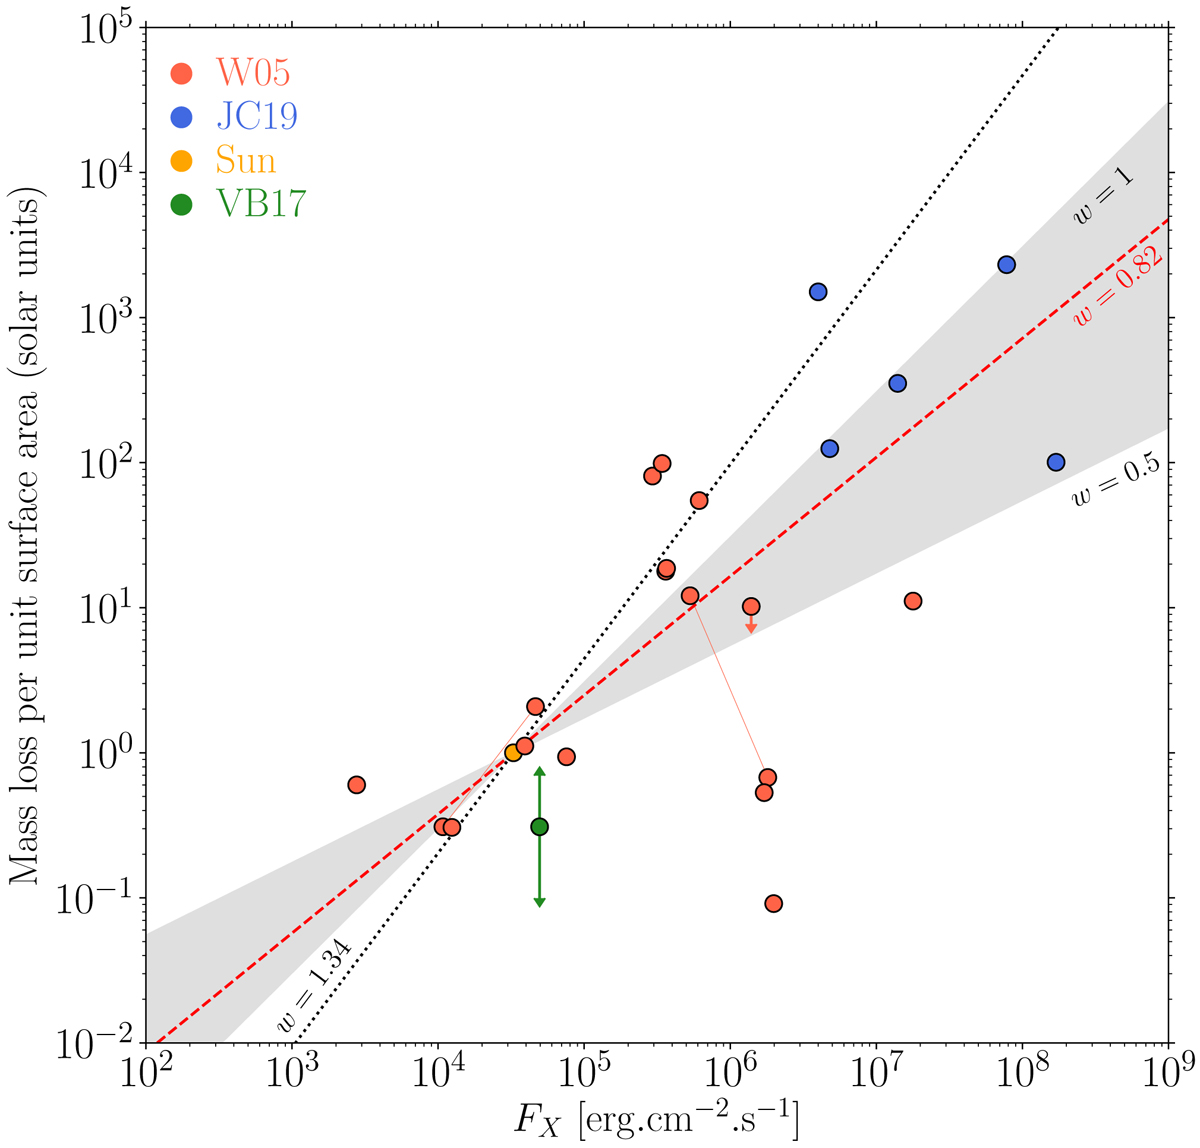
Fig. 6.

Mass loss per unit area as a function of the X-ray flux. The red dots come from Wood et al. (2005; W05) and the blue dots are from Jardine & Collier (2019; JC19). In green: measurements from the atmospheric evaporation of GJ 436b (Vidotto & Bourrier 2017, VB17). Gray dotted line: Wood et al. (2005) scaling law corresponding to w = 1.34. Red dashed line: Suzuki et al. (2013) scaling law corresponding to w = 0.82. The light gray region corresponds to the upper and lower bounds we considered to be consistent with ZDI statistical studies.
Current usage metrics show cumulative count of Article Views (full-text article views including HTML views, PDF and ePub downloads, according to the available data) and Abstracts Views on Vision4Press platform.
Data correspond to usage on the plateform after 2015. The current usage metrics is available 48-96 hours after online publication and is updated daily on week days.
Initial download of the metrics may take a while.


