Fig. 5.
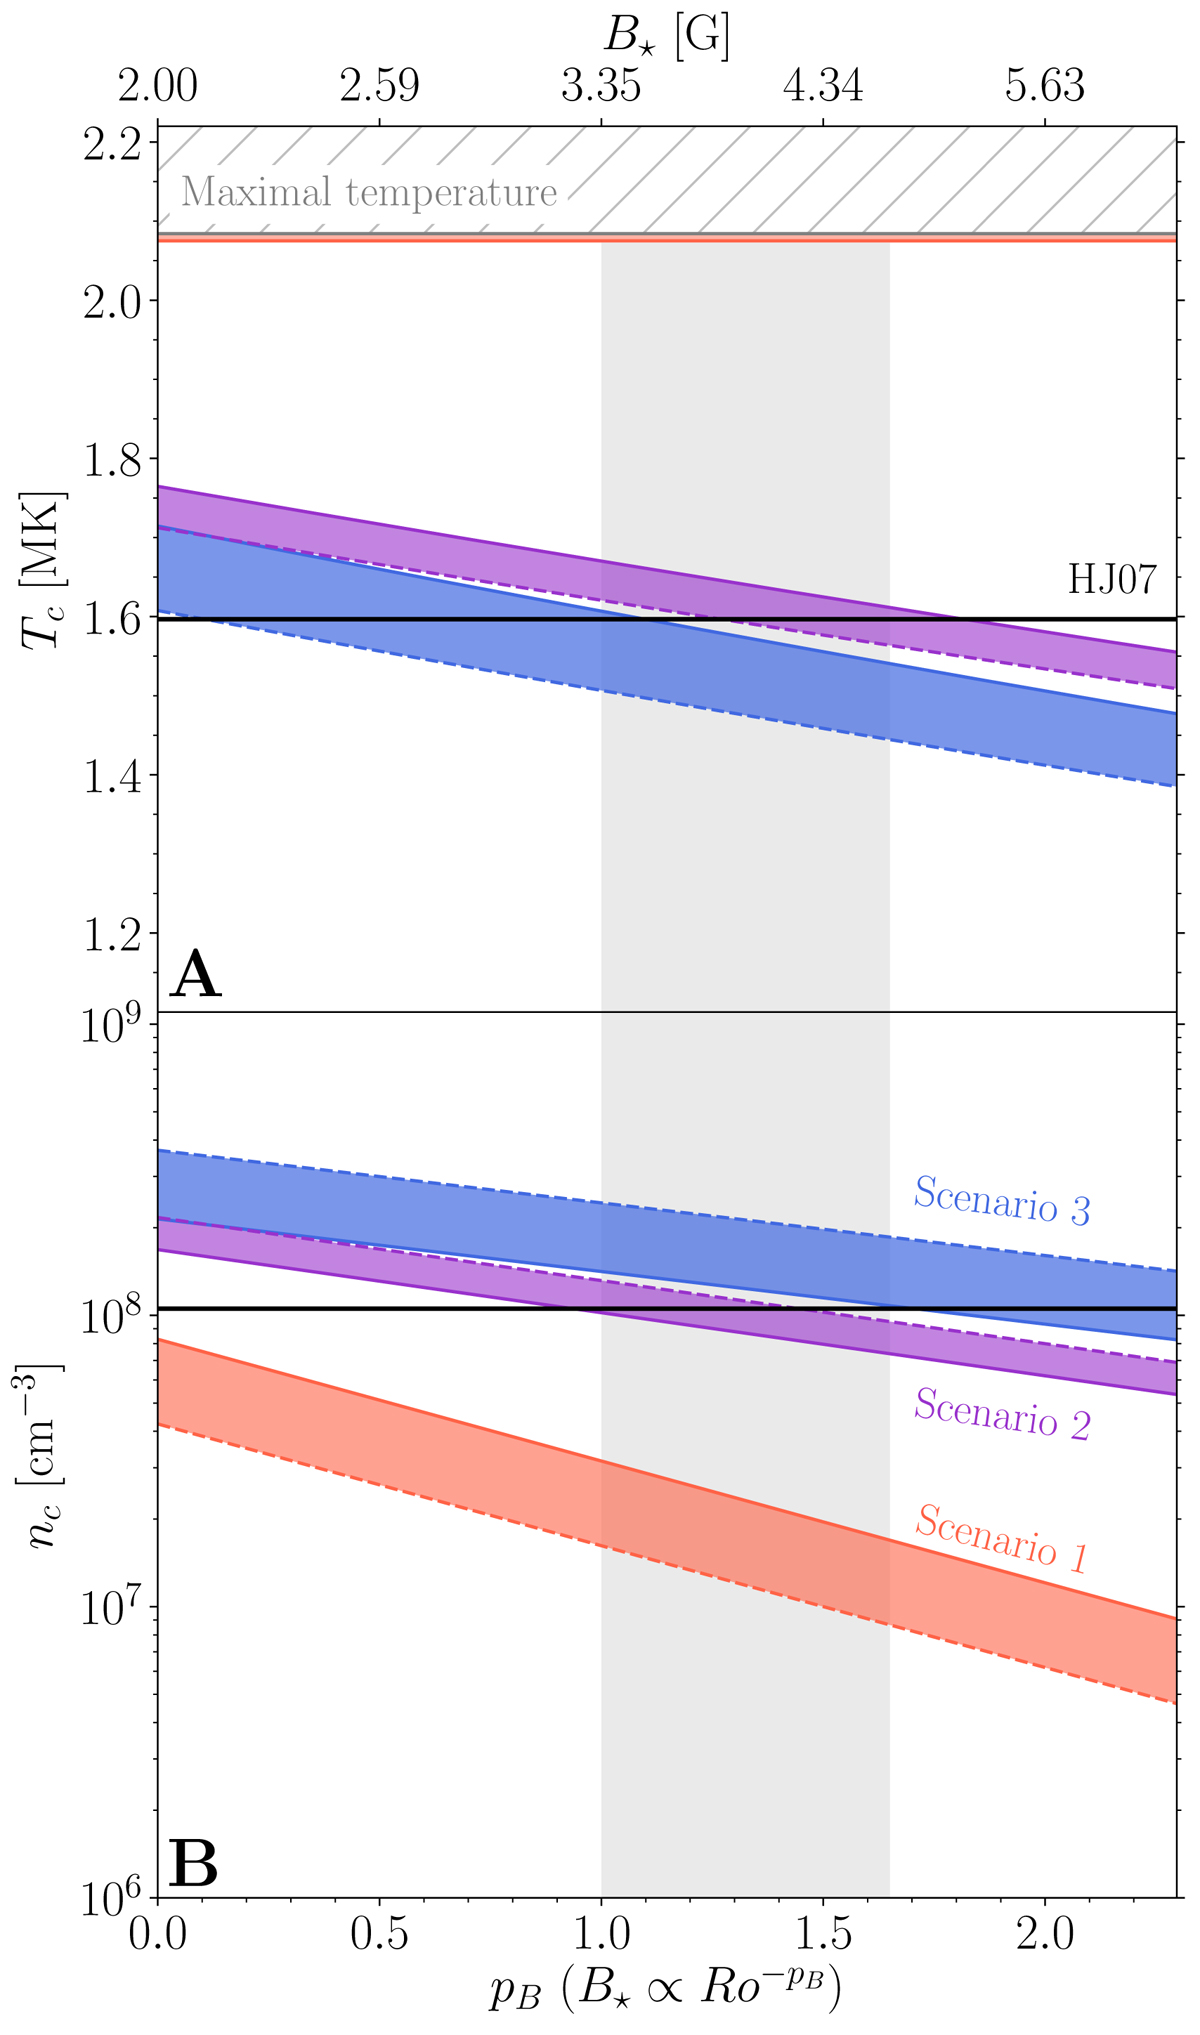
Evolution of Tc (panel A) and nc (panel B) as a function of pB for a solar twin with a rotation period of 15 days. Solid line: pL = 2. Dashed lines: pL = 3. In black: Holzwarth & Jardine (2007) prescription. In light red: single temperature scaling scenario. In purple: entropy equilibrium scenario. In blue: single density scaling scenario. In hatched gray: values of coronal temperatures leading to Ṁ < 0. The light gray band corresponds to the upper and lower bounds of pB, which we consider to be consistent with ZDI statistical studies.
Current usage metrics show cumulative count of Article Views (full-text article views including HTML views, PDF and ePub downloads, according to the available data) and Abstracts Views on Vision4Press platform.
Data correspond to usage on the plateform after 2015. The current usage metrics is available 48-96 hours after online publication and is updated daily on week days.
Initial download of the metrics may take a while.