Fig. 3.
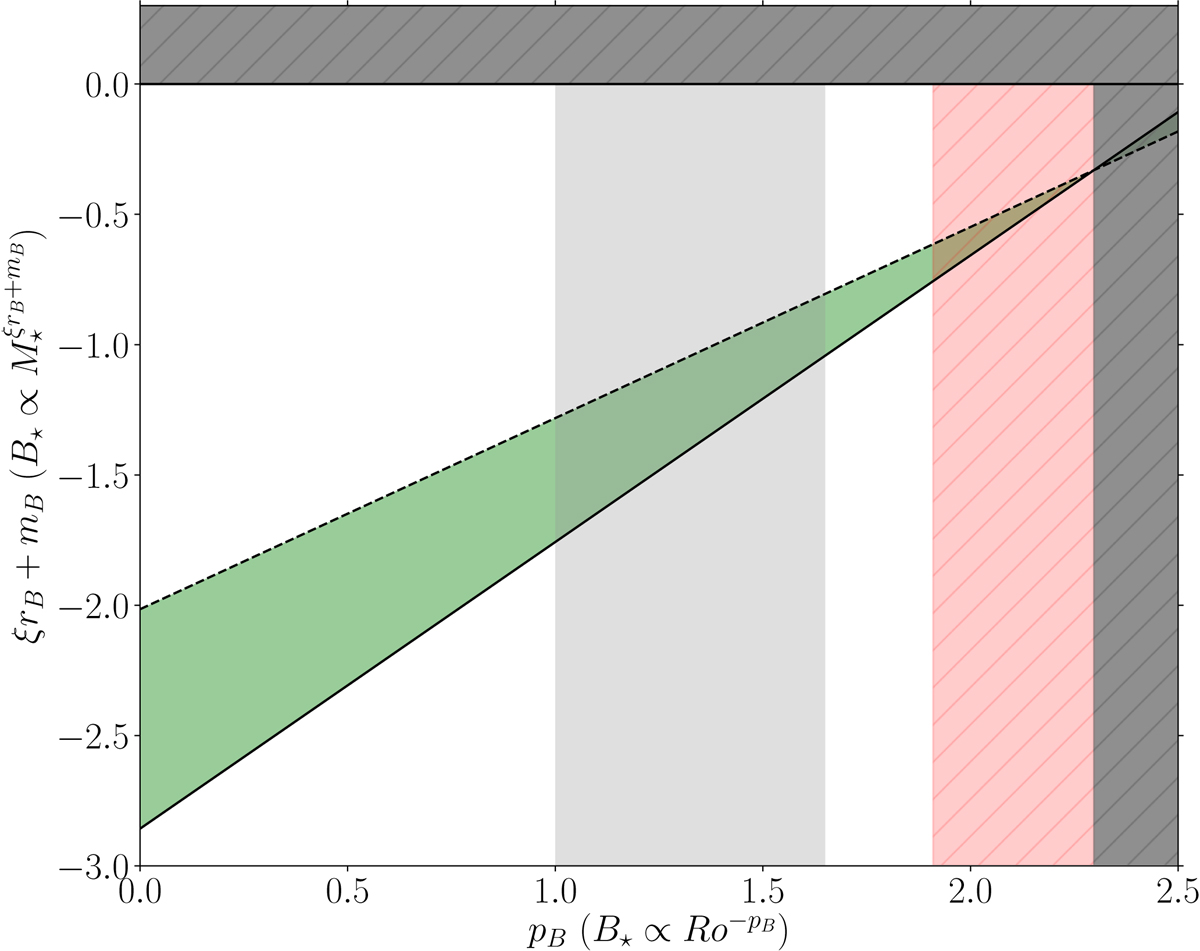
Correlation between pB and ξrB + mB in the unsaturated regime for pL = 2 (black line) and pL = 3 (dotted). Here, η = 4 and ξ = 0.9. In dark gray: excluded region. In red: exponents corresponding to mass losses outside the envelope of Wood et al. (2005) data. In green: exponents consistent with the mass-loss constraints. The light gray band corresponds to the upper and lower bounds from ZDI statistical studies (see Sect. 3.4 for more details).
Current usage metrics show cumulative count of Article Views (full-text article views including HTML views, PDF and ePub downloads, according to the available data) and Abstracts Views on Vision4Press platform.
Data correspond to usage on the plateform after 2015. The current usage metrics is available 48-96 hours after online publication and is updated daily on week days.
Initial download of the metrics may take a while.