Fig. 5.
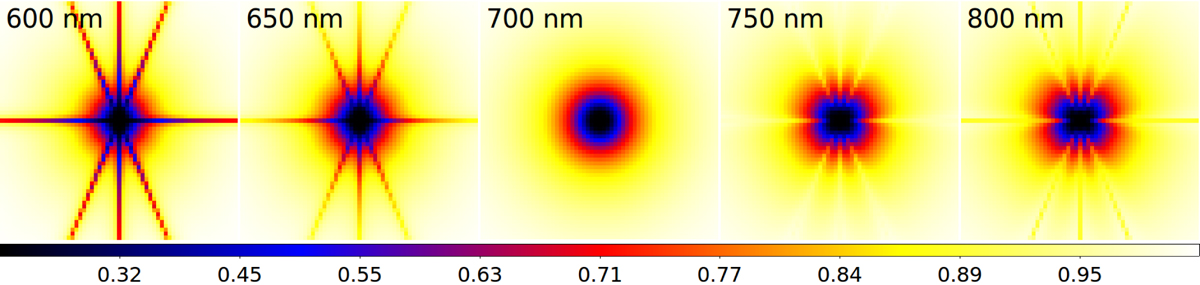
Numerical simulations: Maps of the energy transmission for a point-like source observed through a coronagraph using a wrapped vortex phase mask at wavelengths λ from 600 to 800 nm. The excursion of the source goes from −30 λ/D to 30 λ/D from the center of the phase mask in both horizontal and vertical directions. The color bar goes from 0 (no light is transmitted) to 1 (all flux is transmitted).
Current usage metrics show cumulative count of Article Views (full-text article views including HTML views, PDF and ePub downloads, according to the available data) and Abstracts Views on Vision4Press platform.
Data correspond to usage on the plateform after 2015. The current usage metrics is available 48-96 hours after online publication and is updated daily on week days.
Initial download of the metrics may take a while.