Fig. 17.
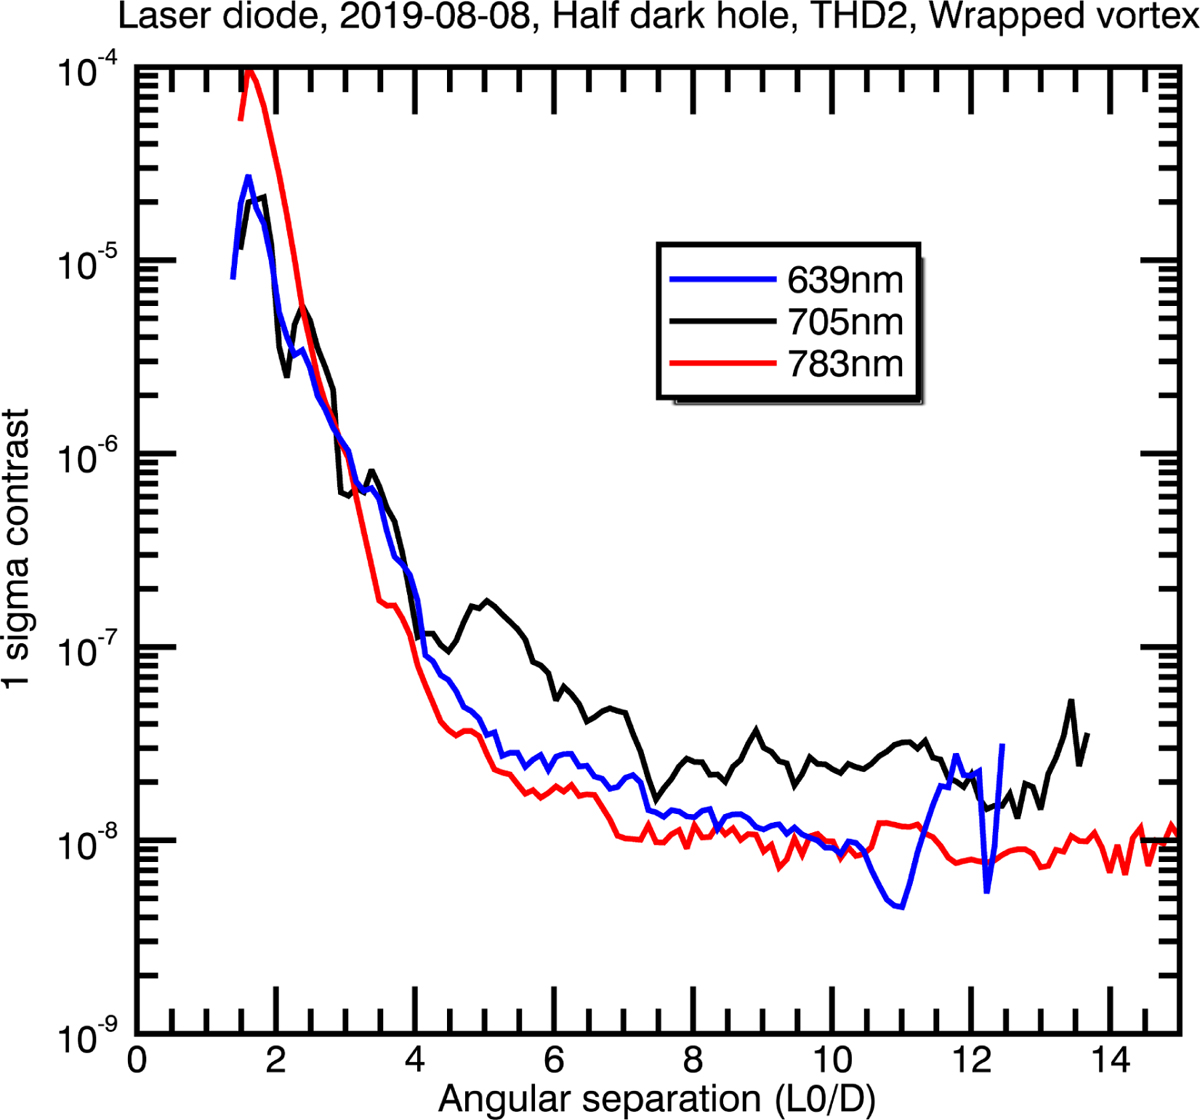
Laboratory measurement: 1σ contrast curves associated with the half dark hole coronagraphic images of Fig. 16 at 639 nm (blue), 705 nm (black), and 783 nm (red). The horizontal axis gives the angular separation from the star in λ0/D with λ0 = 705 nm. These curves are corrected by the coronagraph transmission of an off-axis source (Fig. 11).
Current usage metrics show cumulative count of Article Views (full-text article views including HTML views, PDF and ePub downloads, according to the available data) and Abstracts Views on Vision4Press platform.
Data correspond to usage on the plateform after 2015. The current usage metrics is available 48-96 hours after online publication and is updated daily on week days.
Initial download of the metrics may take a while.