Fig. 14.
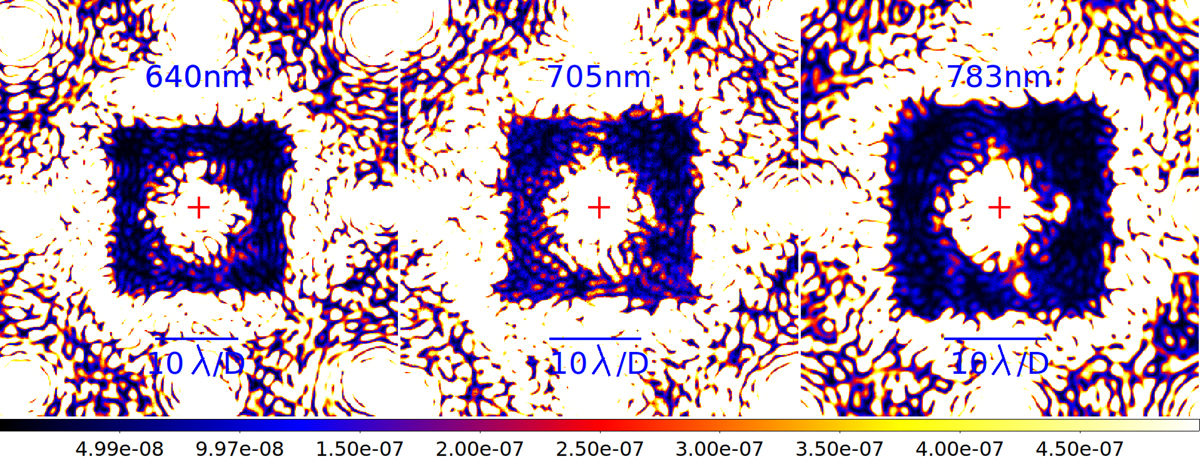
Laboratory measurement: Coronagraphic images obtained at 639 nm (left), 705 nm (center), and 783 nm (right) with a 27λ/D × 27λ/D dark hole. The center of the star image is at the center of the field of view (red cross). Each image is corrected by the coronagraph transmission. The color bar gives the intensity normalized by the maximum of the noncoronagraphic image.
Current usage metrics show cumulative count of Article Views (full-text article views including HTML views, PDF and ePub downloads, according to the available data) and Abstracts Views on Vision4Press platform.
Data correspond to usage on the plateform after 2015. The current usage metrics is available 48-96 hours after online publication and is updated daily on week days.
Initial download of the metrics may take a while.