Fig. 12.
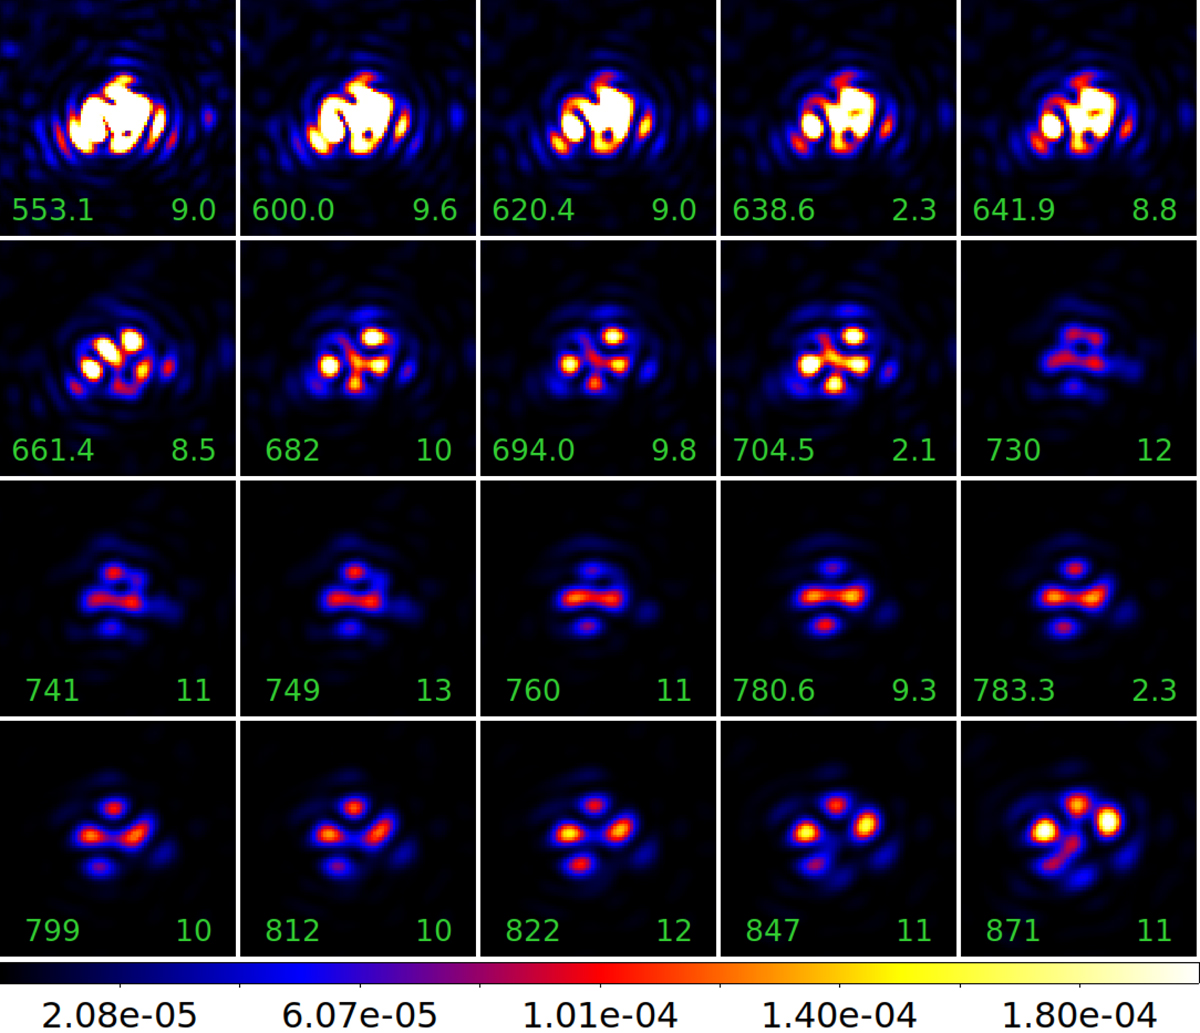
Laboratory measurement: Coronagraphic images recorded at different wavelengths (central wavelength in the bottom left and spectral bandwidth in the bottom right of each image). Speckles are minimized using the laser diode at 783 nm. The image size is 12 λ/D × 12 λ/D at 704.5 nm. The color bar gives the intensity normalized by the maximum of the noncoronagraphic image.
Current usage metrics show cumulative count of Article Views (full-text article views including HTML views, PDF and ePub downloads, according to the available data) and Abstracts Views on Vision4Press platform.
Data correspond to usage on the plateform after 2015. The current usage metrics is available 48-96 hours after online publication and is updated daily on week days.
Initial download of the metrics may take a while.