Open Access
Fig. 11.
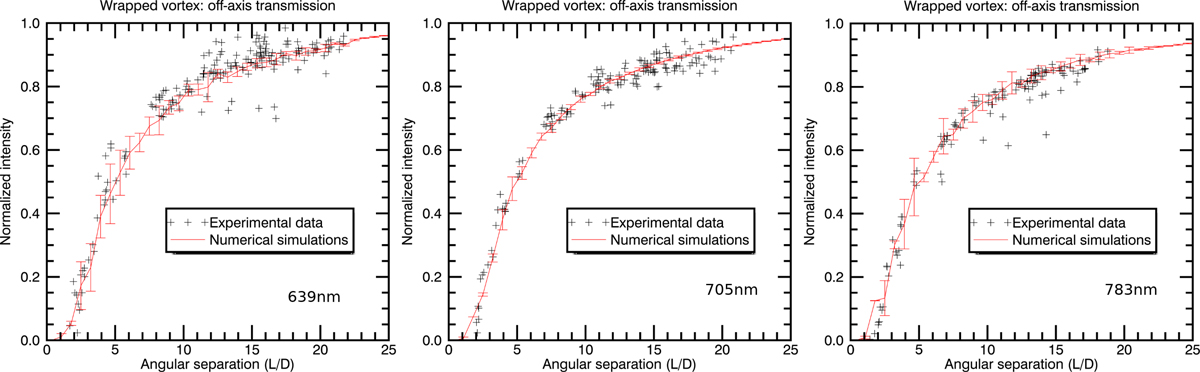
Laboratory measurement: Transmission of an off-axis source through the wrapped vortex coronagraph against the angular separation at three wavelengths: 639 nm (left), 705 nm (middle), and 783 nm (right). Predictions from numerical simulations are plotted in red.
Current usage metrics show cumulative count of Article Views (full-text article views including HTML views, PDF and ePub downloads, according to the available data) and Abstracts Views on Vision4Press platform.
Data correspond to usage on the plateform after 2015. The current usage metrics is available 48-96 hours after online publication and is updated daily on week days.
Initial download of the metrics may take a while.