Fig. 3.
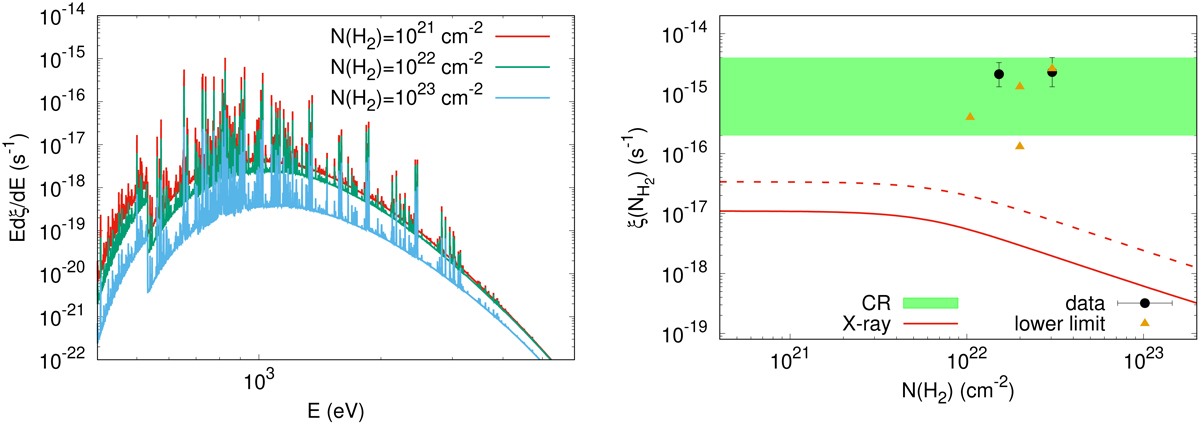
Left: average differential ionization rate for different assumed gas column densities along the line of sight N1 and solar abundance. Right: predictions for the photoionization rate are shown by the solid and dashed red lines (for the cloud with solar abundances and the abundances of the NE source, respectively). Observational data taken from Vaupré et al. (2014) are presented as filled circles (measurements) and filled triangles (lower limits). The shaded region indicates a reference range of values of the ionization rate which has been used to constrain the CR spectrum (see text).
Current usage metrics show cumulative count of Article Views (full-text article views including HTML views, PDF and ePub downloads, according to the available data) and Abstracts Views on Vision4Press platform.
Data correspond to usage on the plateform after 2015. The current usage metrics is available 48-96 hours after online publication and is updated daily on week days.
Initial download of the metrics may take a while.