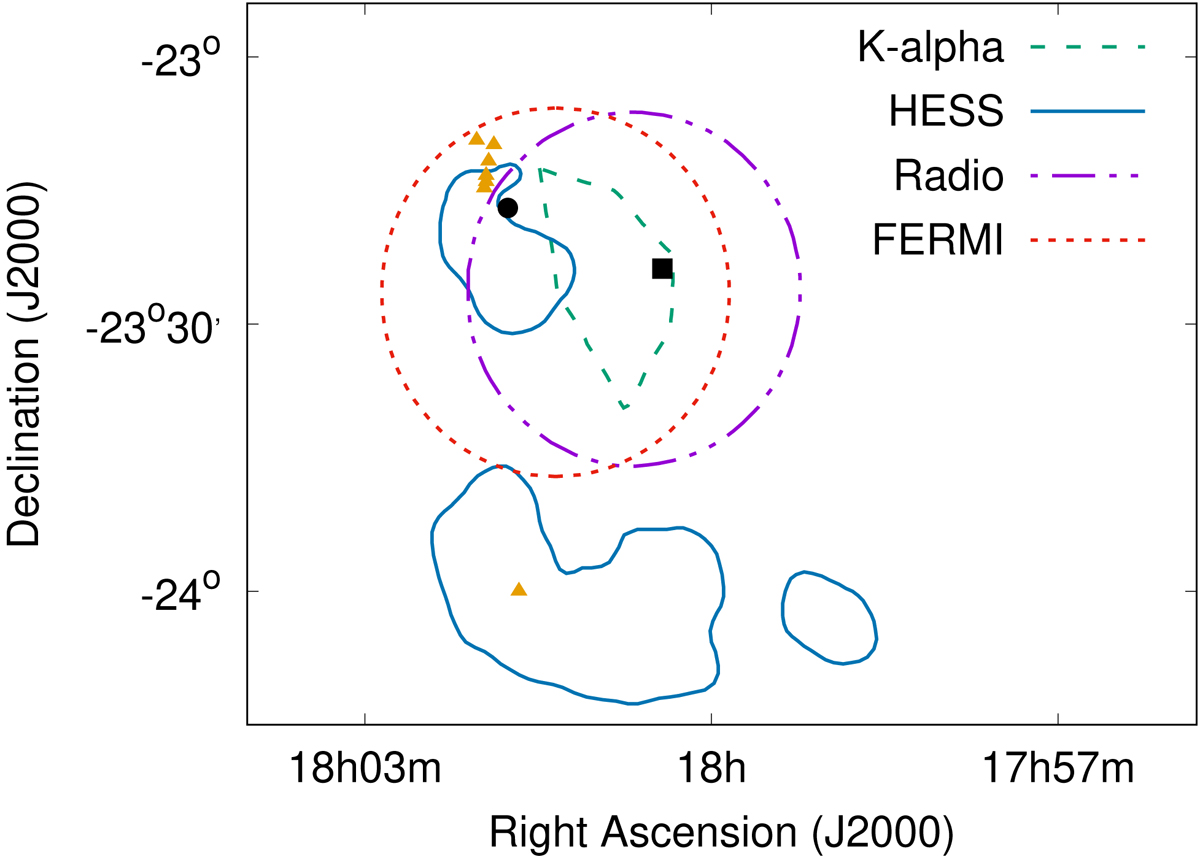
Fig. 1.

Contour map for the W28 region. The approximate radio boundary of the SNR shell is shown as a purple dot–dot-dashed circle. The solid blue contours represent the 4σ significance excess TeV emission observed by H.E.S.S. (Aharonian et al. 2008). The short-dashed red circle is the best-fit disk size for the Fermi-LAT GeV source associated to the northeastern MC (Cui et al. 2018). The enhanced region of Fe I Kα line emission is the area enclosed by the dashed green line (Nobukawa et al. 2018). The CR ionization rate has been measured from IRAM observations pointed in the directions indicated by the yellow triangles (Vaupré et al. 2014). The filled black circle and square indicate the centroids of the X-ray emission for the northeast and central X-ray sources, respectively (Rho & Borkowski 2002).
Current usage metrics show cumulative count of Article Views (full-text article views including HTML views, PDF and ePub downloads, according to the available data) and Abstracts Views on Vision4Press platform.
Data correspond to usage on the plateform after 2015. The current usage metrics is available 48-96 hours after online publication and is updated daily on week days.
Initial download of the metrics may take a while.


