Fig. 7.
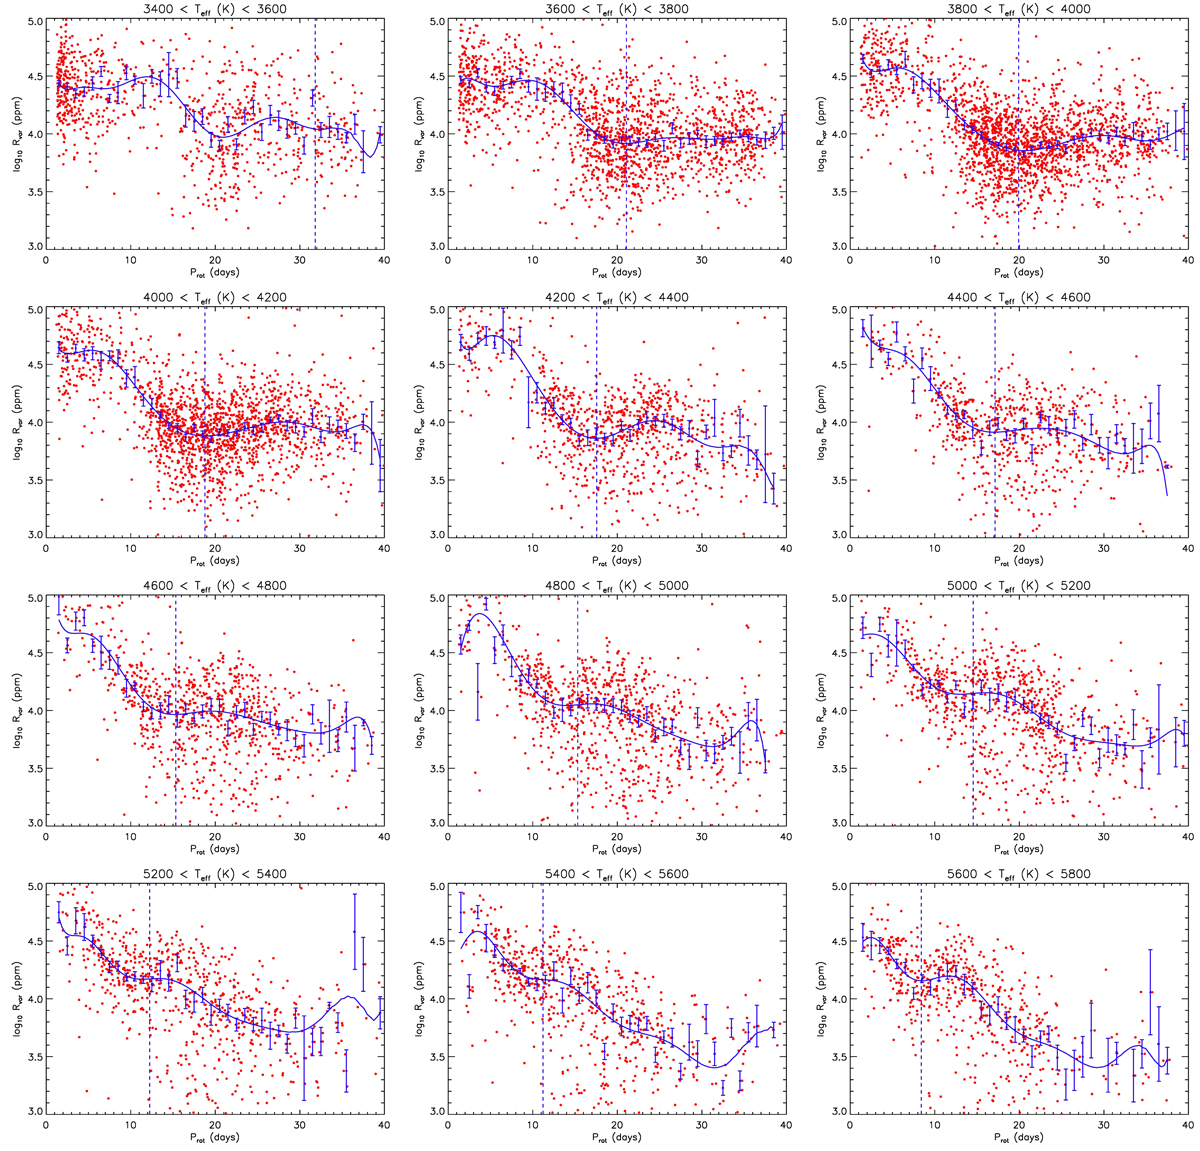
Variability range Rvar versus rotation period Prot for different temperature bins (red dots). The blue dots show the median variability range for period bins of one day, and the error bars indicate the standard error therein. The blue solid line shows a spline fit to the median values. The blue dashed vertical lines indicate local minima of the variability range.
Current usage metrics show cumulative count of Article Views (full-text article views including HTML views, PDF and ePub downloads, according to the available data) and Abstracts Views on Vision4Press platform.
Data correspond to usage on the plateform after 2015. The current usage metrics is available 48-96 hours after online publication and is updated daily on week days.
Initial download of the metrics may take a while.