Open Access
Fig. 2.
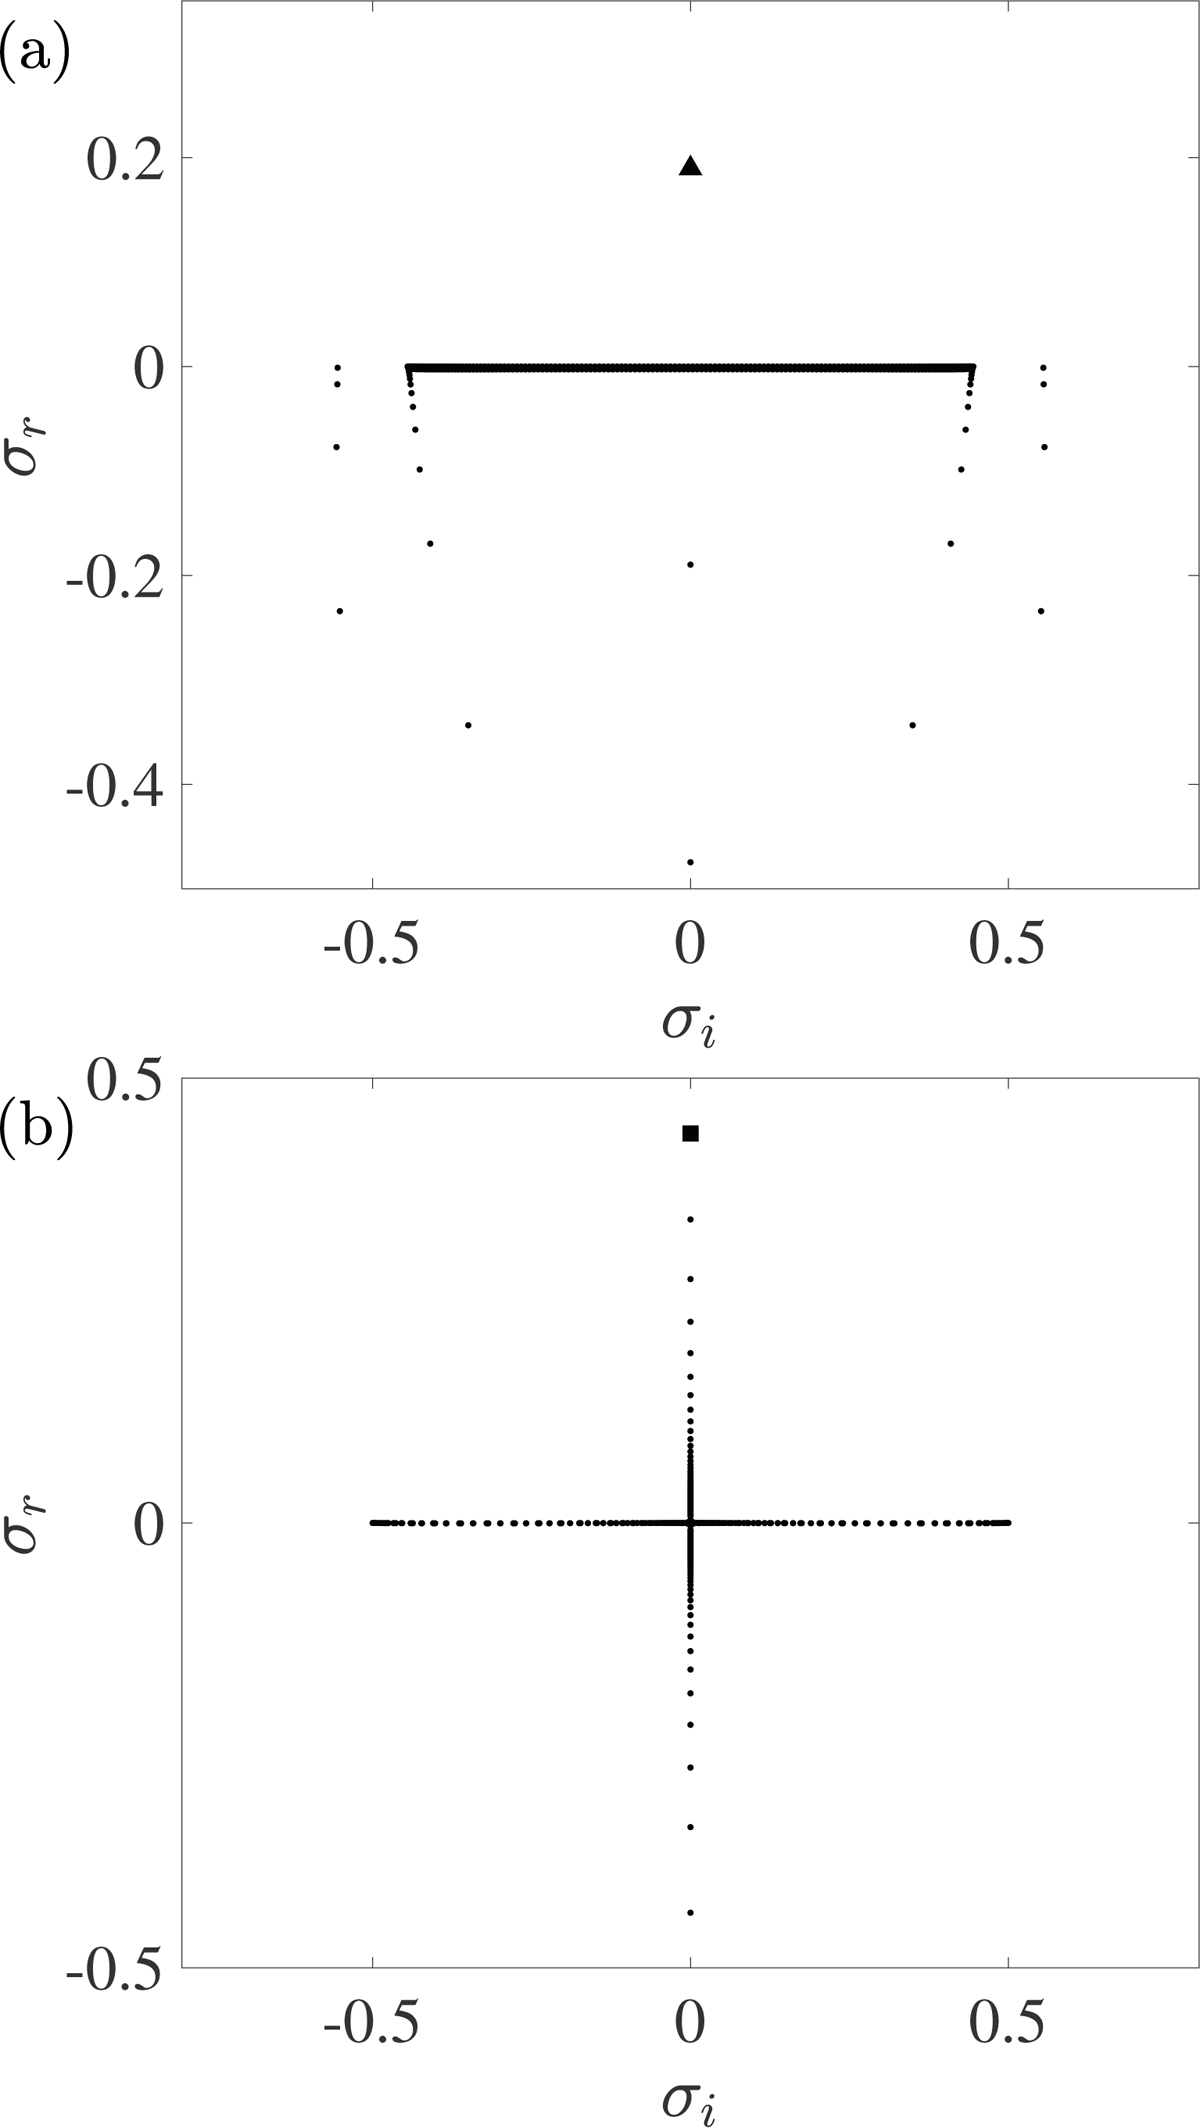
Eigenvalue spectra at (a) (kx, kz) = (0.445, 0) and (b) (kx, kz) = (0, 5) for f = 0.5, N = 1, and Pe = 0.1. The triangle in (a) and the square in (b) denote the most unstable growth rates of the inflectional and inertial instabilities, respectively.
Current usage metrics show cumulative count of Article Views (full-text article views including HTML views, PDF and ePub downloads, according to the available data) and Abstracts Views on Vision4Press platform.
Data correspond to usage on the plateform after 2015. The current usage metrics is available 48-96 hours after online publication and is updated daily on week days.
Initial download of the metrics may take a while.