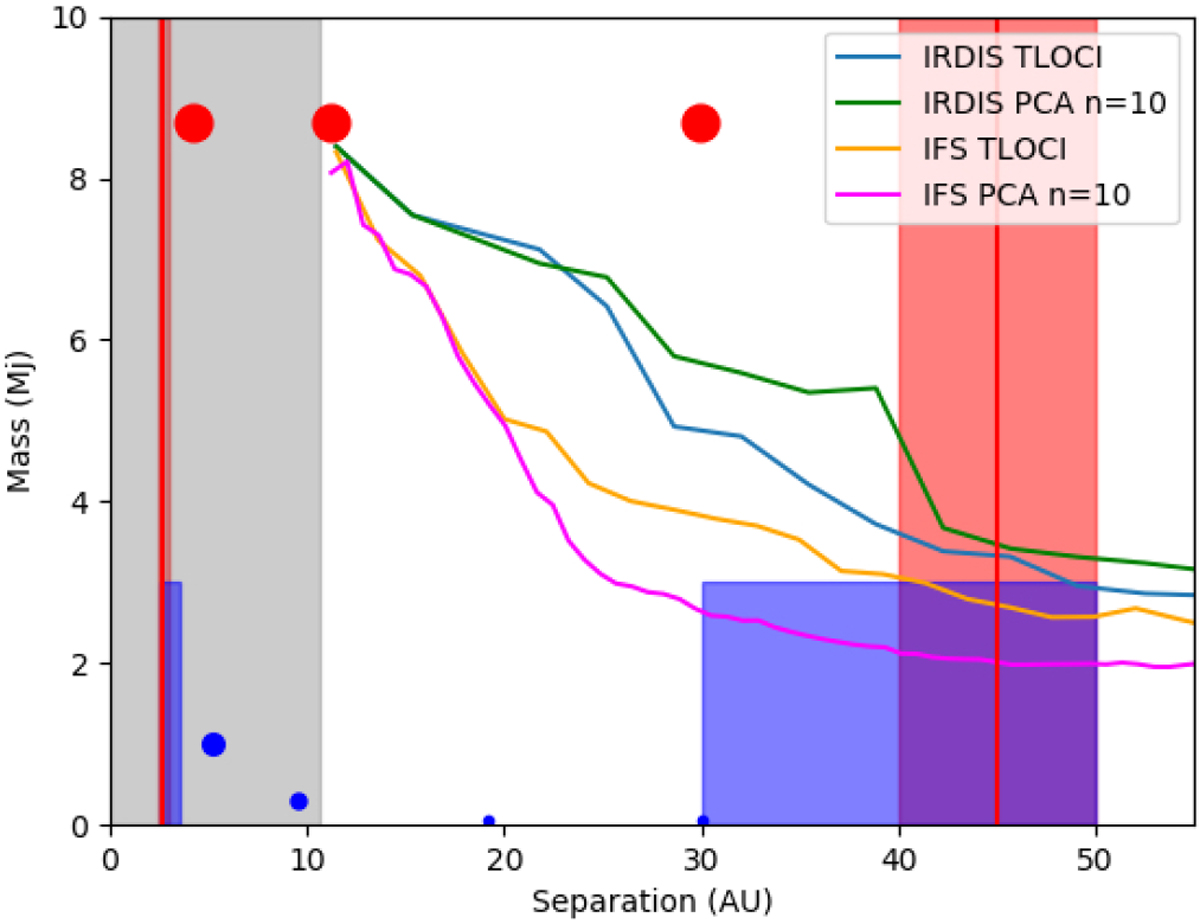
Fig. 7

Detection limits for the companion mass in IRDIS and IFS datasets post-processed with TLOCI and PCA (10 modes). The red dots indicate the mass and semimajor axis of planets in the tested three planet configuration. The red vertical lines show the radial location of the inner and outer planetesimal belts, and the red shaded areas show their approximate extents. For comparison, the blue dots indicate the mass and semimajor axis of the Jovian planets, and the blue shaded areas show the extents of the main asteroid belt (between 2.5 and 3.5 au; Wyatt 2008) and the Edgeworth–Kuiper belt (between 30 and 50 au; Stern & Colwell 1997) in the Solar System. The gray shaded region shows the IWA of the coronagraph.
Current usage metrics show cumulative count of Article Views (full-text article views including HTML views, PDF and ePub downloads, according to the available data) and Abstracts Views on Vision4Press platform.
Data correspond to usage on the plateform after 2015. The current usage metrics is available 48-96 hours after online publication and is updated daily on week days.
Initial download of the metrics may take a while.


