Fig. 5
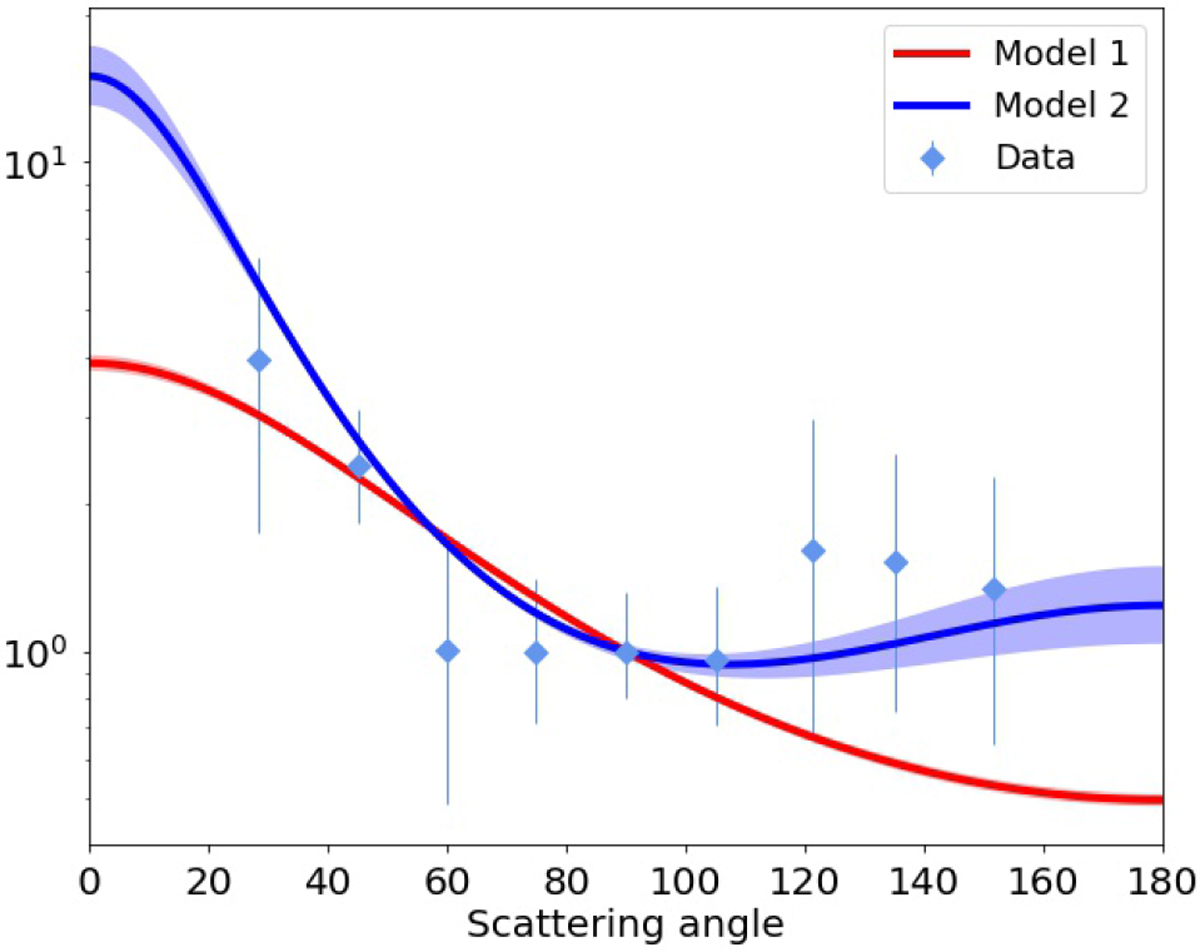
Comparison of the SPFs with one HG function (model 1 in Table 3) and a combination with two HG functions (model 2 in Table 3). Blue diamonds show the measured phase function in the total intensity disk image. Red and blue shaded areas cover the range of uncertainty on parameters obtained from the MCMC posterior distributions.
Current usage metrics show cumulative count of Article Views (full-text article views including HTML views, PDF and ePub downloads, according to the available data) and Abstracts Views on Vision4Press platform.
Data correspond to usage on the plateform after 2015. The current usage metrics is available 48-96 hours after online publication and is updated daily on week days.
Initial download of the metrics may take a while.