Fig. 4
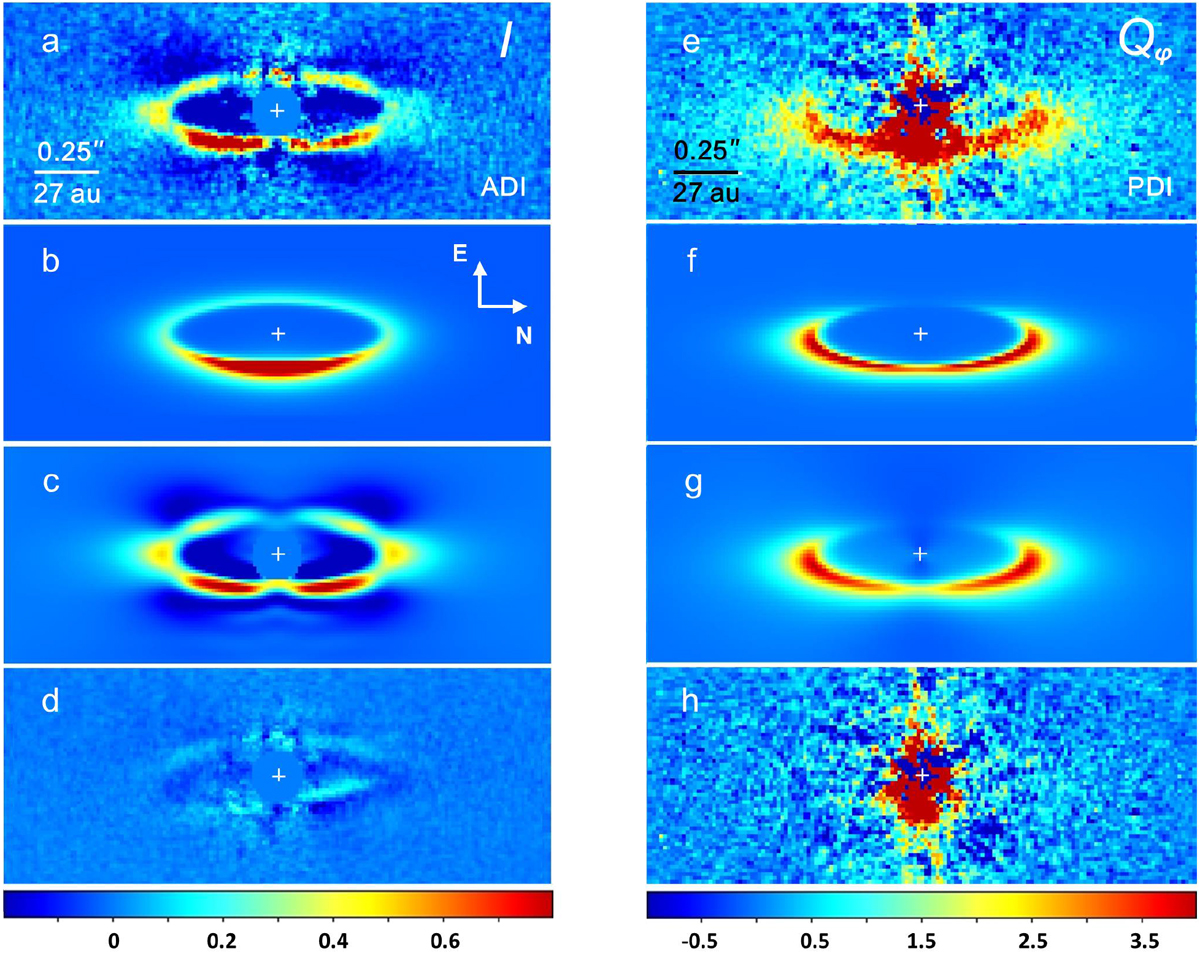
Comparison of the total intensity image (panel a) and the Qφ image (panel e) with the models of scattered light (panel b) and scattered polarized light (panel f). Panels c and g: models after convolution with the instrumental PSF and post-processing. Panels d and h: residual images obtained after subtracting the model images from the total intensity image and the Qφ image. White crosses indicate the position of the star. Color bars show flux in counts per pixel.
Current usage metrics show cumulative count of Article Views (full-text article views including HTML views, PDF and ePub downloads, according to the available data) and Abstracts Views on Vision4Press platform.
Data correspond to usage on the plateform after 2015. The current usage metrics is available 48-96 hours after online publication and is updated daily on week days.
Initial download of the metrics may take a while.