Fig. A.1
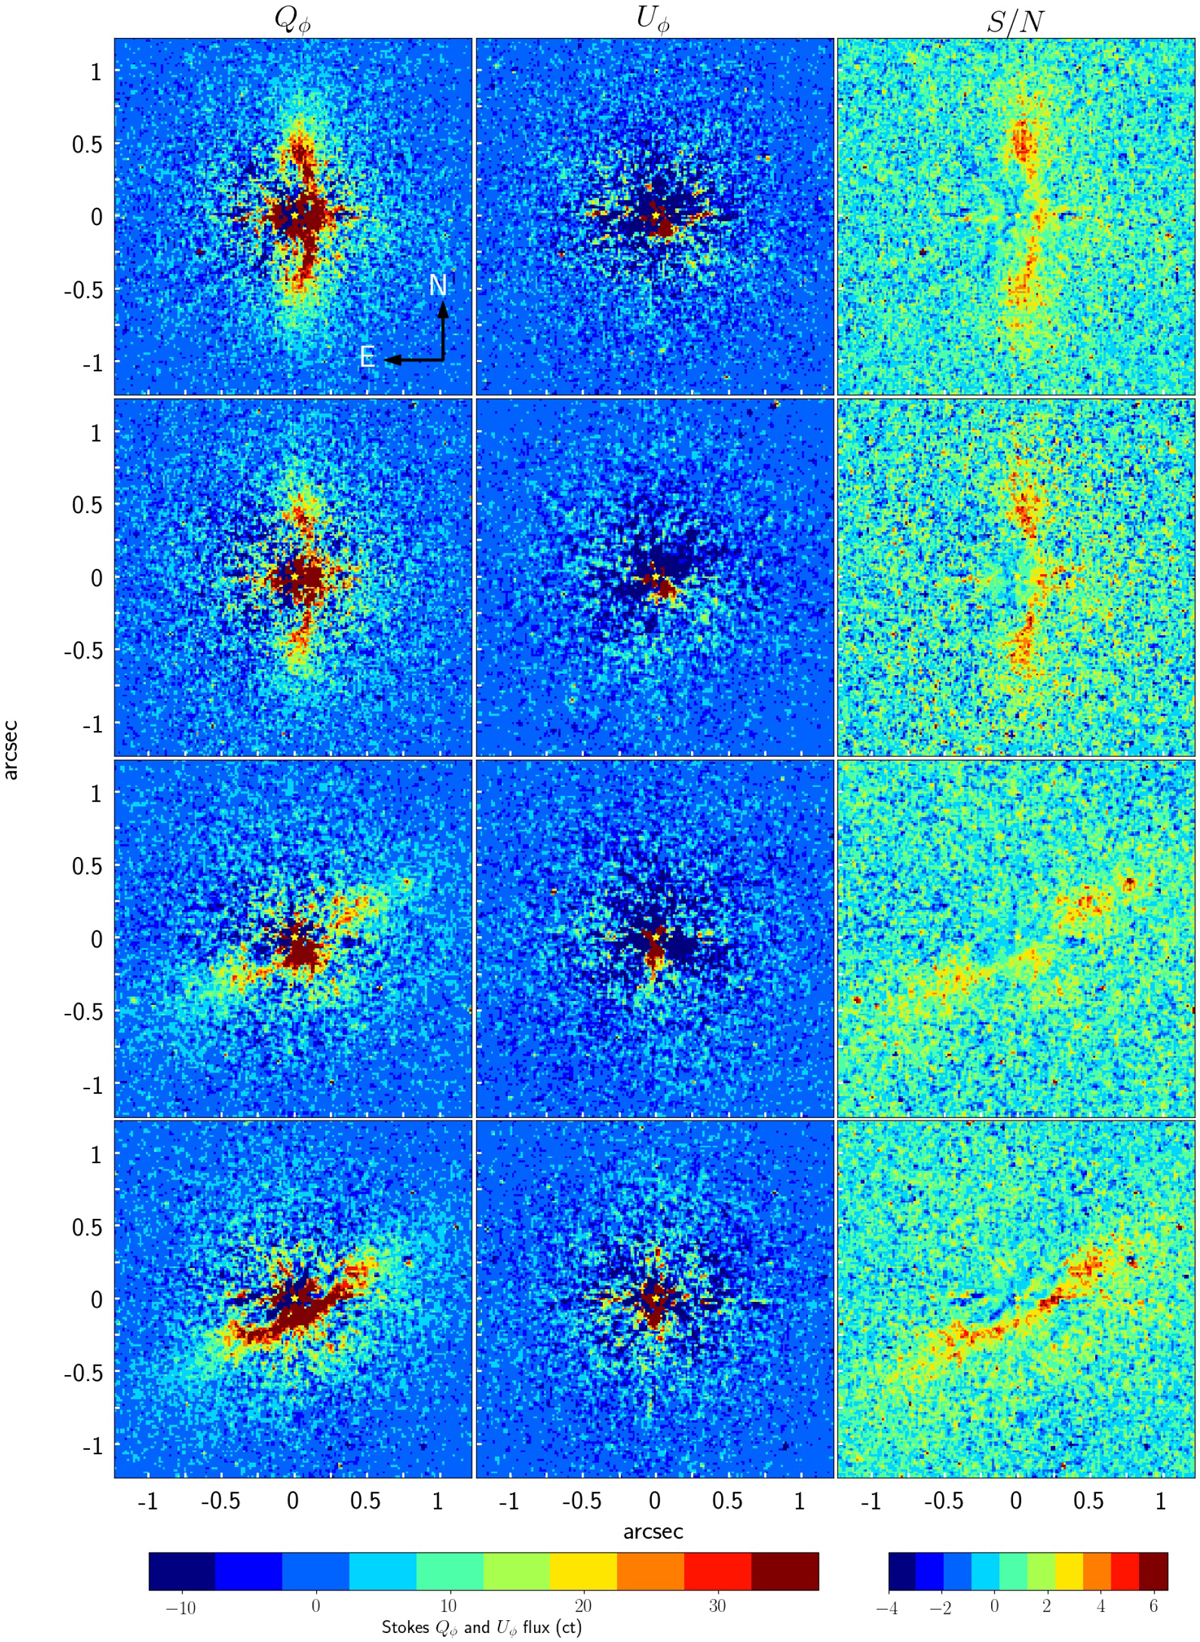
Qφ (left column) and Uφ (middle column) images and the S/N maps (right column) of the polarimetric data per block of SP cycles. First three rows: data of first three blocks of SP cycles taken on 2018 February 28. Data recorded on 2018 June 22 are shown in the bottom row. Data in the lower two rows are taken with the sky field rotated by 60° on detector.
Current usage metrics show cumulative count of Article Views (full-text article views including HTML views, PDF and ePub downloads, according to the available data) and Abstracts Views on Vision4Press platform.
Data correspond to usage on the plateform after 2015. The current usage metrics is available 48-96 hours after online publication and is updated daily on week days.
Initial download of the metrics may take a while.