Fig. 7.
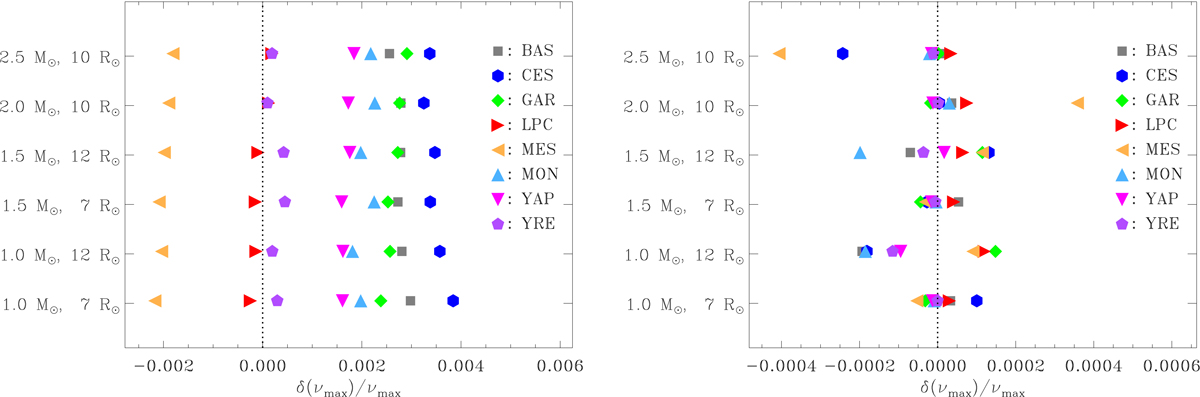
Relative differences in the estimated frequency νmax of maximum power, compared with the ASTEC results, in the sense (model) – (ASTEC); the different codes are identified by the symbol shape and colour (cf. caption to Fig. 3). Left panel: results for the solar-calibrated models, and right panel: for the RGB-calibrated models (note the different scales on the abscissas).
Current usage metrics show cumulative count of Article Views (full-text article views including HTML views, PDF and ePub downloads, according to the available data) and Abstracts Views on Vision4Press platform.
Data correspond to usage on the plateform after 2015. The current usage metrics is available 48-96 hours after online publication and is updated daily on week days.
Initial download of the metrics may take a while.