Fig. F.3.
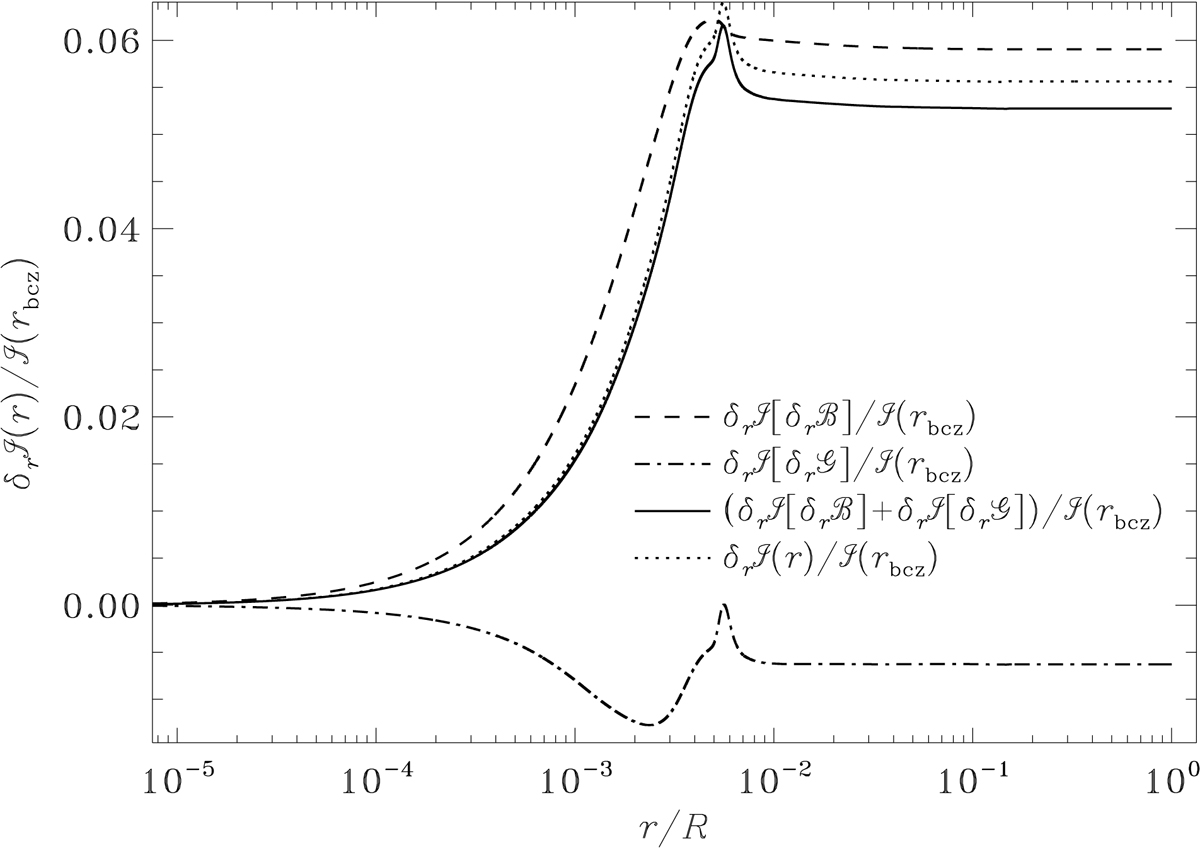
Differences in the partial integrals for differences in Π0 (cf. Eq. (F.7)) between the original LPCODE 2.5 M⊙, 10 R⊙ solar-calibrated model and the ASTEC model, in the sense (LPCODE) – (ASTEC). The dashed and dash-dotted lines show the contributions δrℐ[δrℬ] and δrℐ[δr𝒢] from δrℬ and δr𝒢, respectively, and the solid line shows their sum. For comparison, the dotted line shows the relative difference in ℐ.
Current usage metrics show cumulative count of Article Views (full-text article views including HTML views, PDF and ePub downloads, according to the available data) and Abstracts Views on Vision4Press platform.
Data correspond to usage on the plateform after 2015. The current usage metrics is available 48-96 hours after online publication and is updated daily on week days.
Initial download of the metrics may take a while.