Fig. F.2.
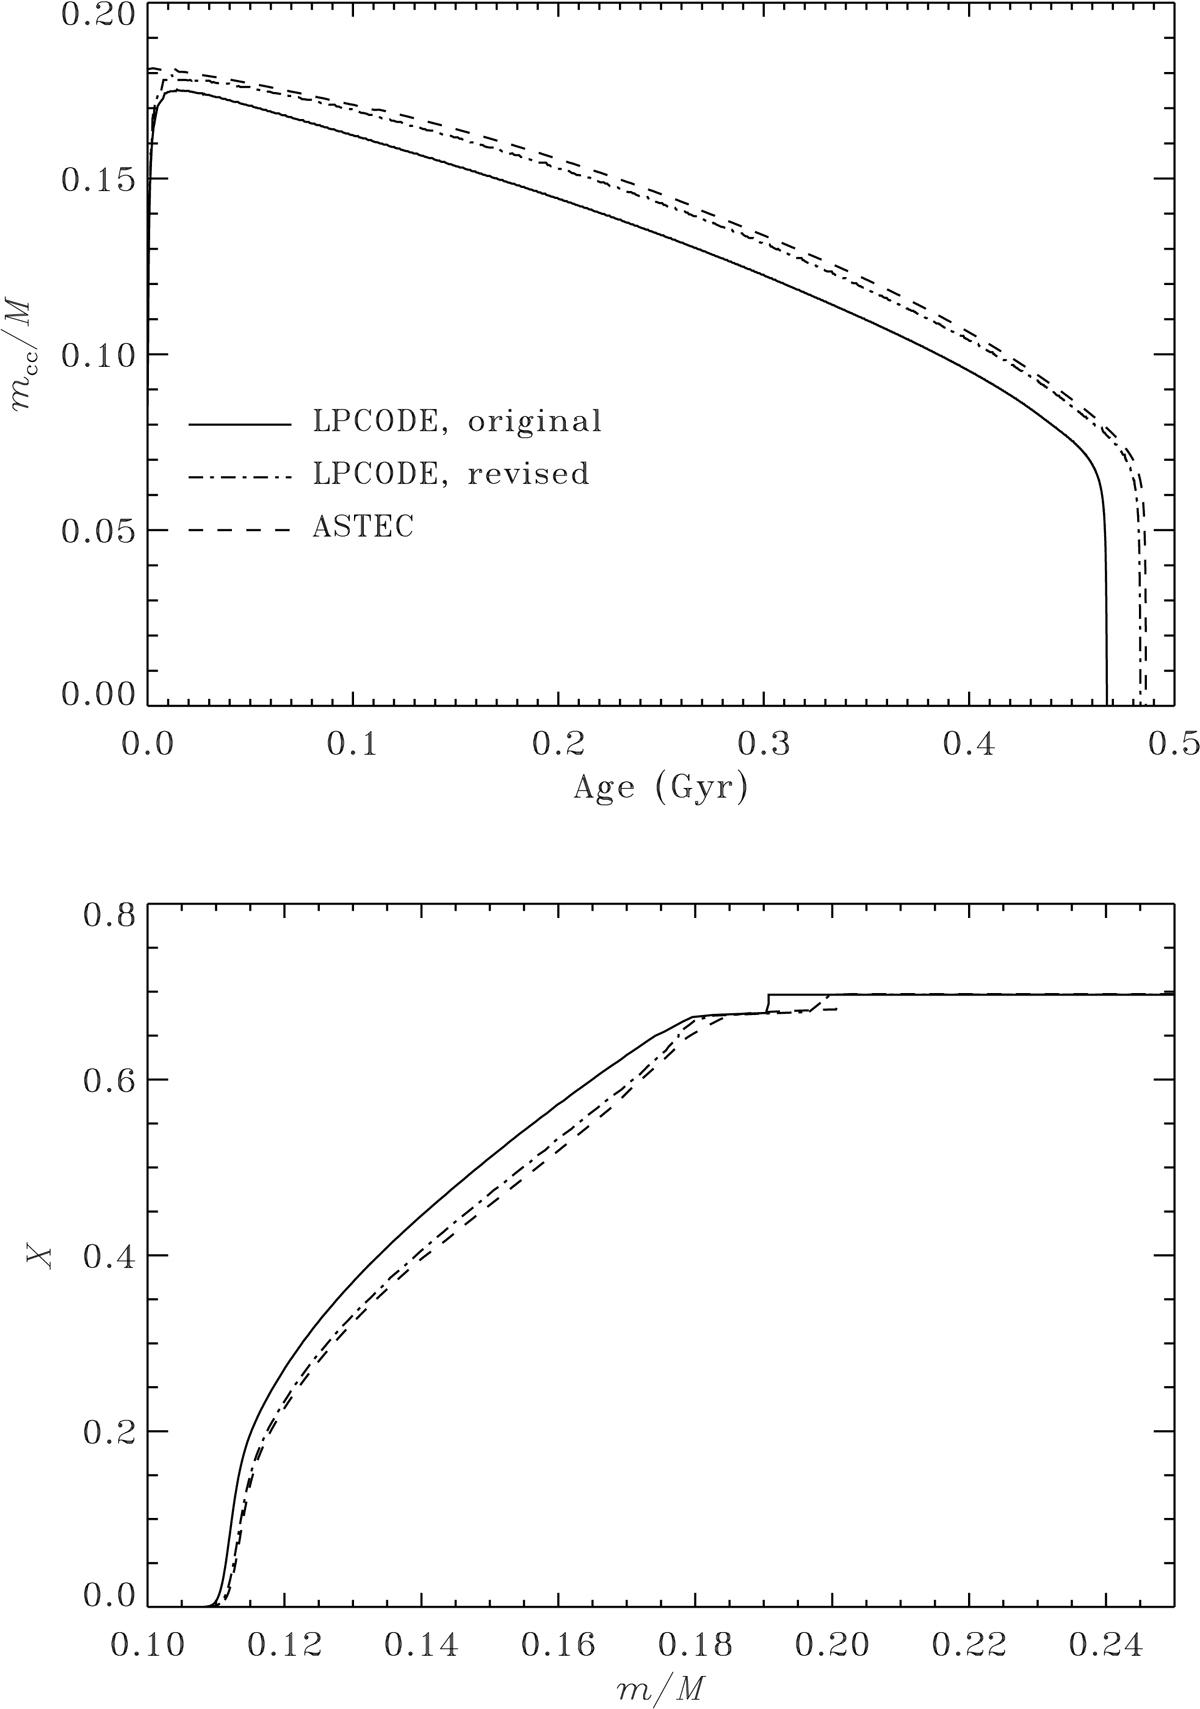
Top panel: variation with age in the fractional mass of the convective core, in 2.5 M⊙ solar-calibrated models. Bottom panel: resulting profiles of the hydrogen-abundance X in the 10 R⊙ red-giant model. The solid and dot-dashed lines show the original and revised LPCODE models, and the dashed lines show the corresponding ASTEC model.
Current usage metrics show cumulative count of Article Views (full-text article views including HTML views, PDF and ePub downloads, according to the available data) and Abstracts Views on Vision4Press platform.
Data correspond to usage on the plateform after 2015. The current usage metrics is available 48-96 hours after online publication and is updated daily on week days.
Initial download of the metrics may take a while.