Fig. 2.
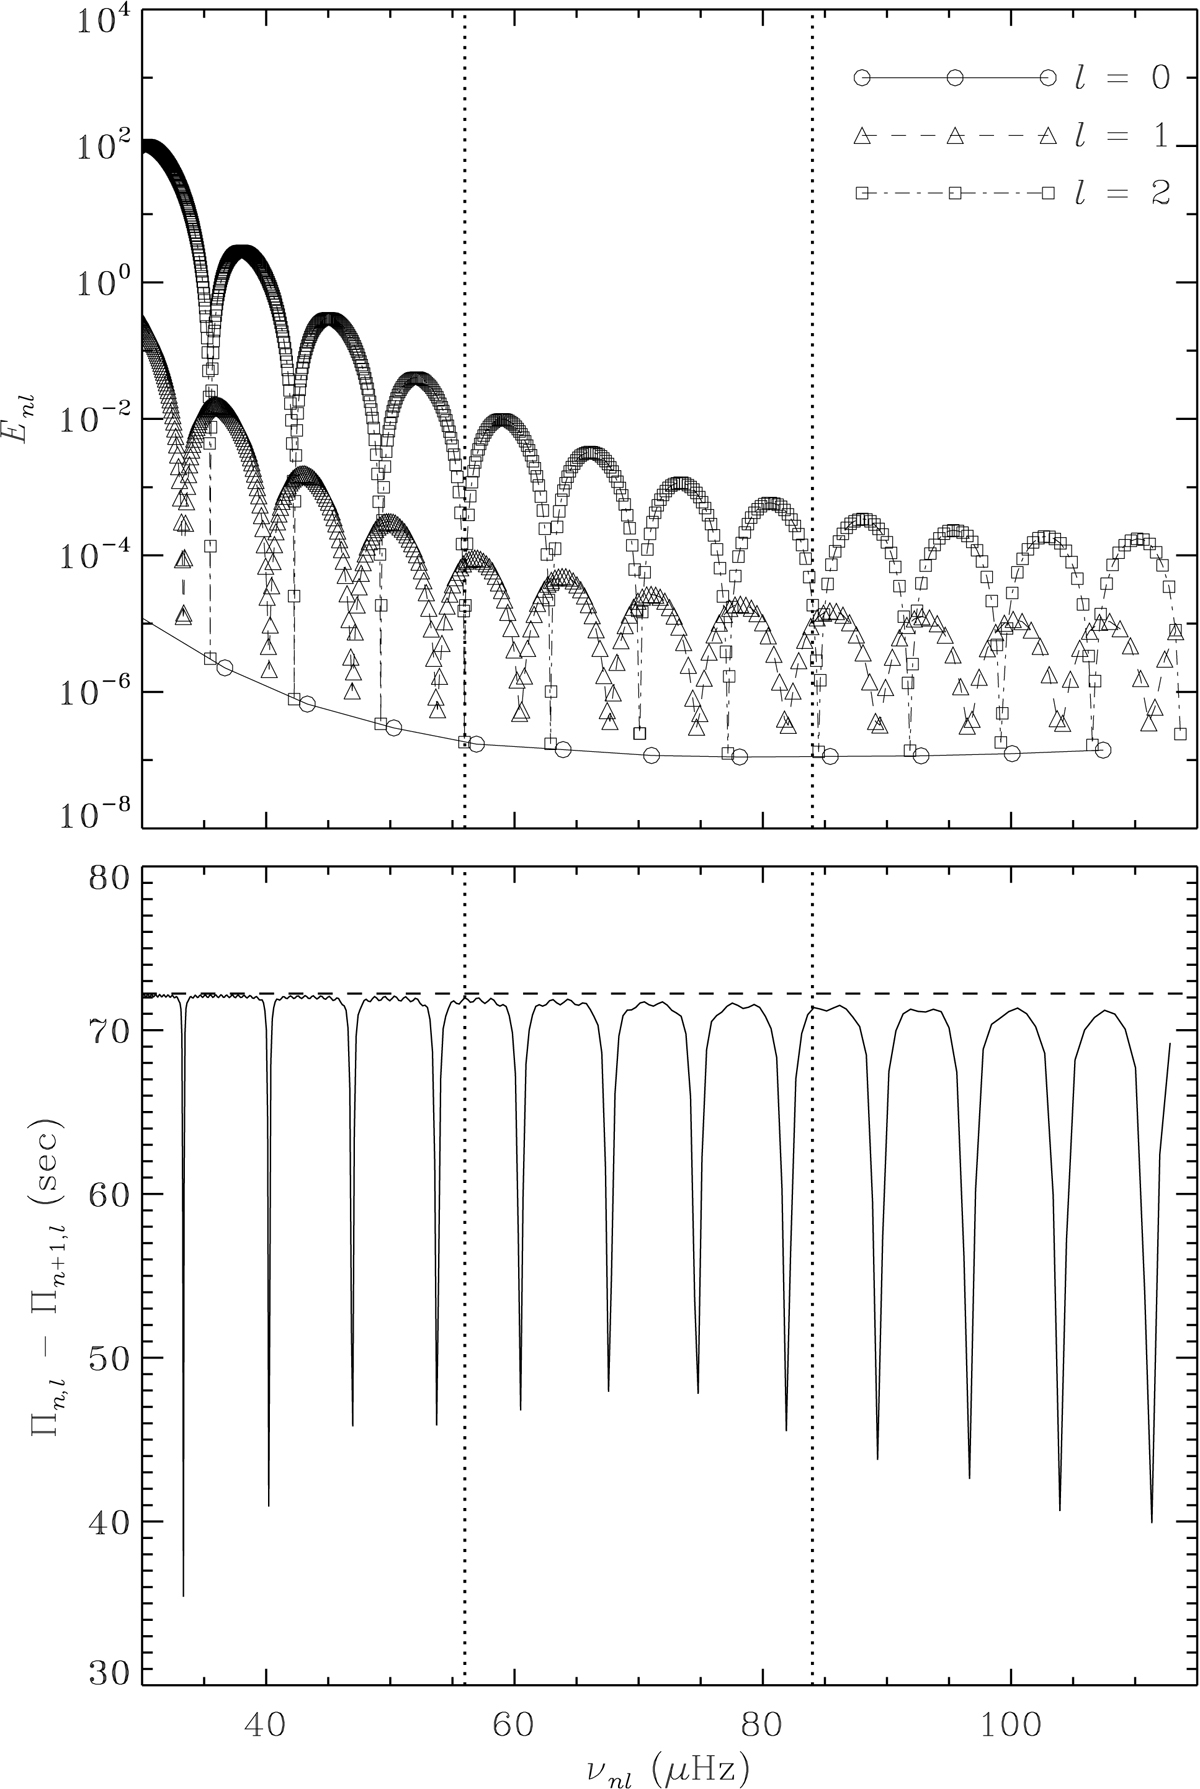
Top panel: mode inertia (cf. Eq. (9)) for modes of degree l = 0 (solid line, circles), 1 (dashed line, triangles), and 2 (dot-dashed line, squares), in the ASTEC 1 M⊙, 7 R⊙ model. Bottom panel: separation between periods of adjacent modes with l = 1 in this model, plotted against frequency. The horizontal dashed line shows the asymptotic period spacing ![]() (cf. Eqs. (5) and (6)). The heavy vertical dotted lines show the frequency interval where power is half its maximum value, according to the fit of Mosser et al. (2012) (see also Appendix A.3).
(cf. Eqs. (5) and (6)). The heavy vertical dotted lines show the frequency interval where power is half its maximum value, according to the fit of Mosser et al. (2012) (see also Appendix A.3).
Current usage metrics show cumulative count of Article Views (full-text article views including HTML views, PDF and ePub downloads, according to the available data) and Abstracts Views on Vision4Press platform.
Data correspond to usage on the plateform after 2015. The current usage metrics is available 48-96 hours after online publication and is updated daily on week days.
Initial download of the metrics may take a while.