Fig. A.5.
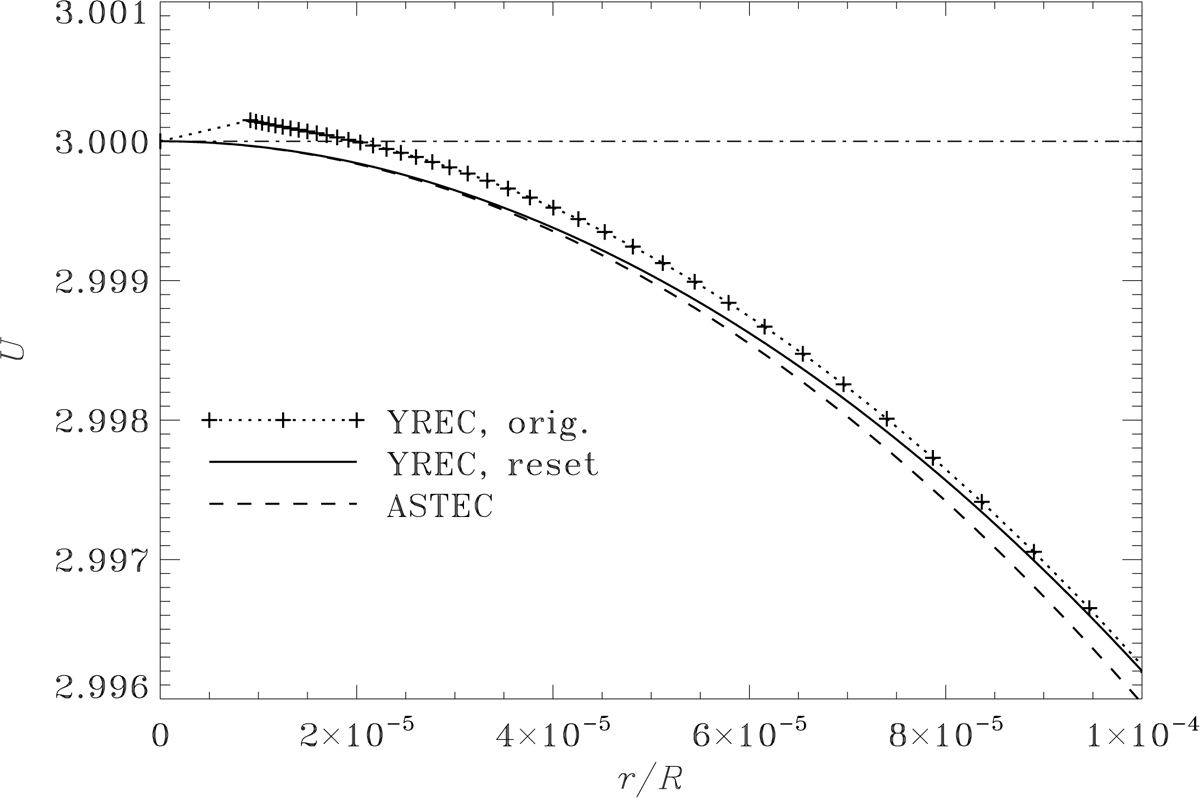
Behaviour of U (cf. Eq. (A.13)), in three models with M = 1 M⊙, R = 7 R⊙. The dotted curve shows the original YREC model, the pluses marking the mesh points in the evolution calculation. The solid line shows the same model, after application of the correction procedure discussed in the text. For comparison, the dashed curve shows the corresponding ASTEC model, for which no correction had to be applied. The thin dot-dashed line marks U = 3.
Current usage metrics show cumulative count of Article Views (full-text article views including HTML views, PDF and ePub downloads, according to the available data) and Abstracts Views on Vision4Press platform.
Data correspond to usage on the plateform after 2015. The current usage metrics is available 48-96 hours after online publication and is updated daily on week days.
Initial download of the metrics may take a while.