Fig. 1.
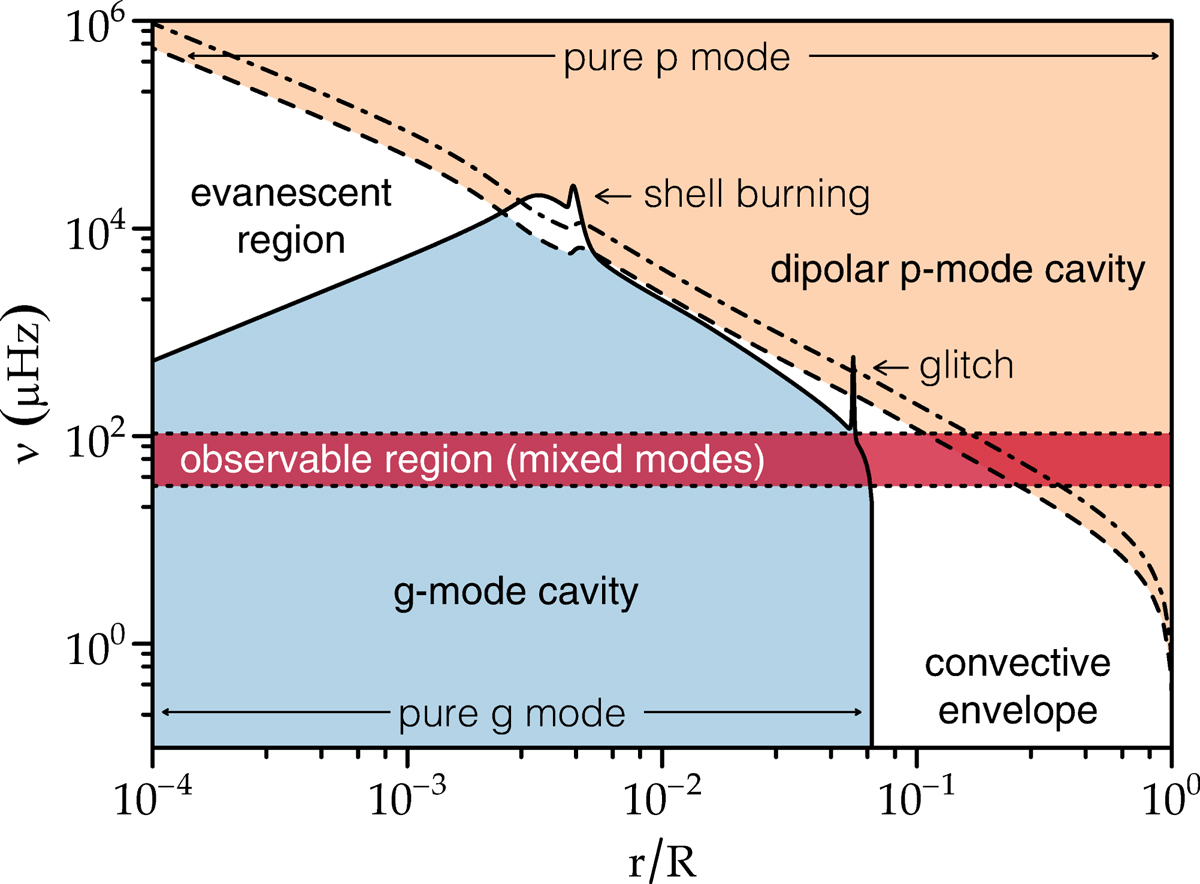
Characteristic frequencies Sl/2π for l = 1 and 2 (dashed and dot-dashed; cf. Eq. (1)) and N/2π (solid; cf. Eq. (2)) in the ASTEC 1 M⊙, 7 R⊙ model. The horizontal red band marks the region around νmax, the estimated frequency of maximum oscillation power (cf. Eq. (8)), where observed modes are expected. The blue and orange areas indicate the corresponding regions of g- and p-mode behaviour, for l = 1. The glitch in the buoyancy frequency is caused by the near-discontinuity in the hydrogen abundance resulting from the penetration, during the first dredge-up, of the convective envelope into a region where the composition has been modified by nuclear reactions (see also Paper I).
Current usage metrics show cumulative count of Article Views (full-text article views including HTML views, PDF and ePub downloads, according to the available data) and Abstracts Views on Vision4Press platform.
Data correspond to usage on the plateform after 2015. The current usage metrics is available 48-96 hours after online publication and is updated daily on week days.
Initial download of the metrics may take a while.