Fig. 6.
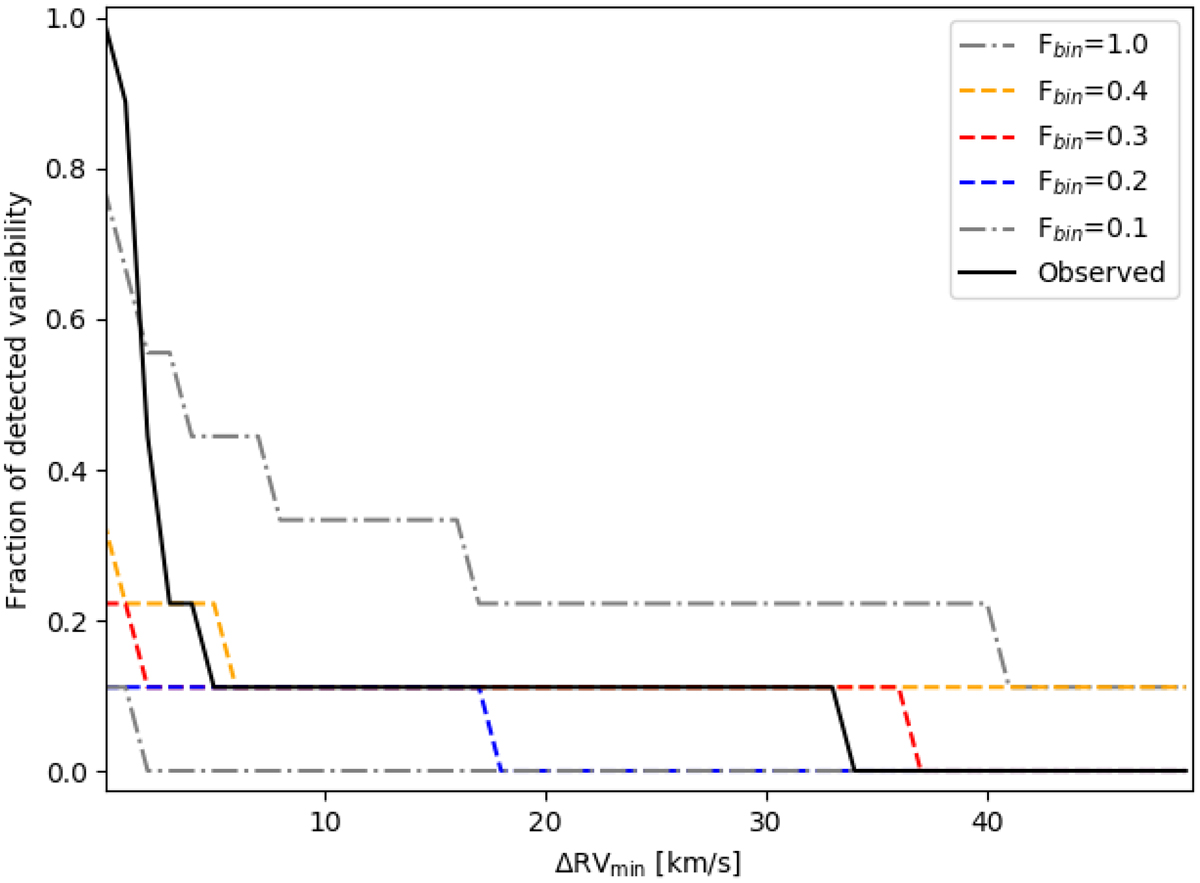
Observed fraction of detected variability of the RSGs in NGC 330 as a function of the ΔRVmin parameter for the nine RSGs with HARPS data (black solid line). The three best-fitting simulated stellar populations with an empirically defined distribution from Moe & Di Stefano (2017), containing between 20% and 40% binary systems with orbital periods in the range 2.3 < logP[day] < 4.3, are shown with dashed coloured lines. The dot-dashed grey lines show the limits of simulations containing a binary fraction of 10% and 100%. The time sampling, uncertainties, and number of targets of the simulations is chosen to match the HARPS data. Each simulated curve is an average of 10 000 iterations, but to best compare with the observations, the simulated curves are discretised to the same intervals as the observations.
Current usage metrics show cumulative count of Article Views (full-text article views including HTML views, PDF and ePub downloads, according to the available data) and Abstracts Views on Vision4Press platform.
Data correspond to usage on the plateform after 2015. The current usage metrics is available 48-96 hours after online publication and is updated daily on week days.
Initial download of the metrics may take a while.