Fig. 4.
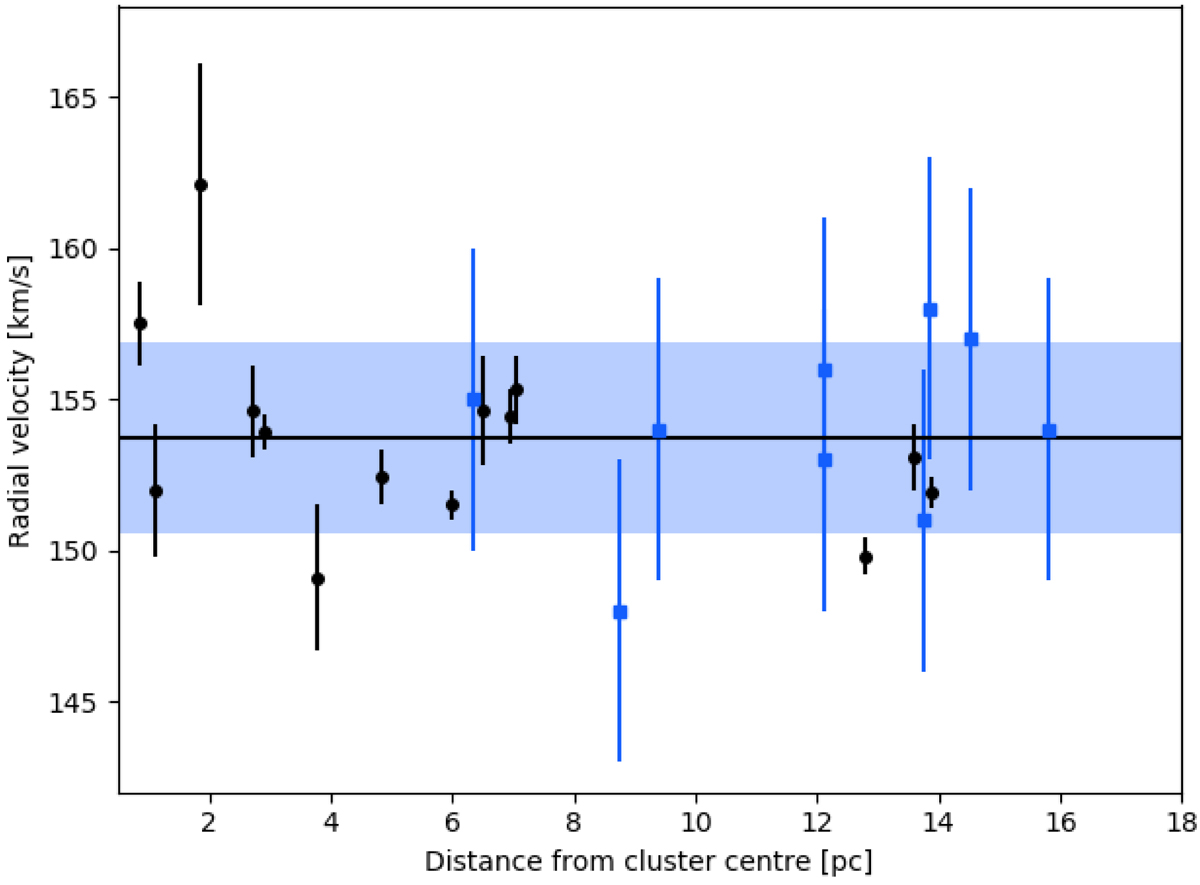
Average radial velocities as a function of distance from the centre of the cluster (as defined by Mackey & Gilmore 2003). Black points show average velocities of the RSGs with RV estimates from Table 1, and blue squares show OBA-type stars from Evans et al. (2006). The black solid line and blue shaded region illustrate the systemic velocity and velocity dispersion of the cluster estimated using a combination of RSGs and OBA-type stars (153.7 ± 3.2 km s−1; where the uncertainty quoted and displayed here is the σ1D measured in Sect. 3.1). The black points with the largest uncertainties are those with only MUSE data.
Current usage metrics show cumulative count of Article Views (full-text article views including HTML views, PDF and ePub downloads, according to the available data) and Abstracts Views on Vision4Press platform.
Data correspond to usage on the plateform after 2015. The current usage metrics is available 48-96 hours after online publication and is updated daily on week days.
Initial download of the metrics may take a while.