Fig. 3.
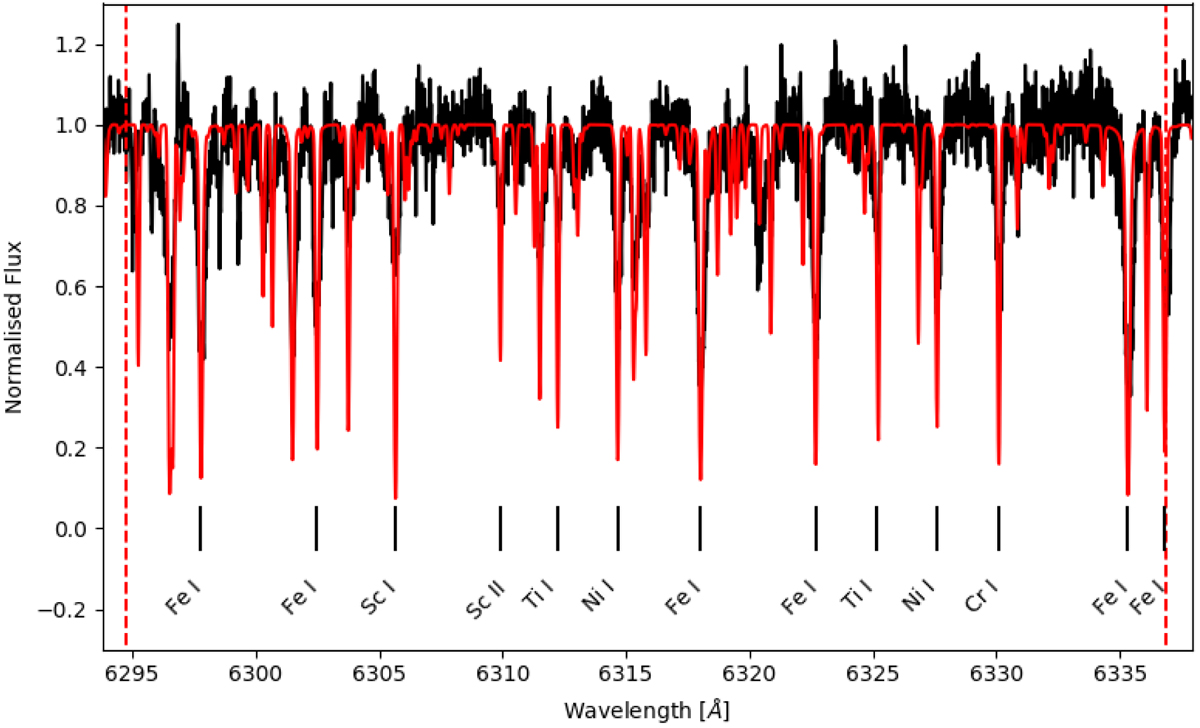
Example slice used in the RV estimation for the HARPS data. Some of the strongest lines are highlighted, demonstrating the density of spectral features present in a typical slice. The template spectrum calculated from a MARCS model atmosphere is overlaid in red, and the red dashed vertical lines highlight the edges of the slice.
Current usage metrics show cumulative count of Article Views (full-text article views including HTML views, PDF and ePub downloads, according to the available data) and Abstracts Views on Vision4Press platform.
Data correspond to usage on the plateform after 2015. The current usage metrics is available 48-96 hours after online publication and is updated daily on week days.
Initial download of the metrics may take a while.