Fig. 3.
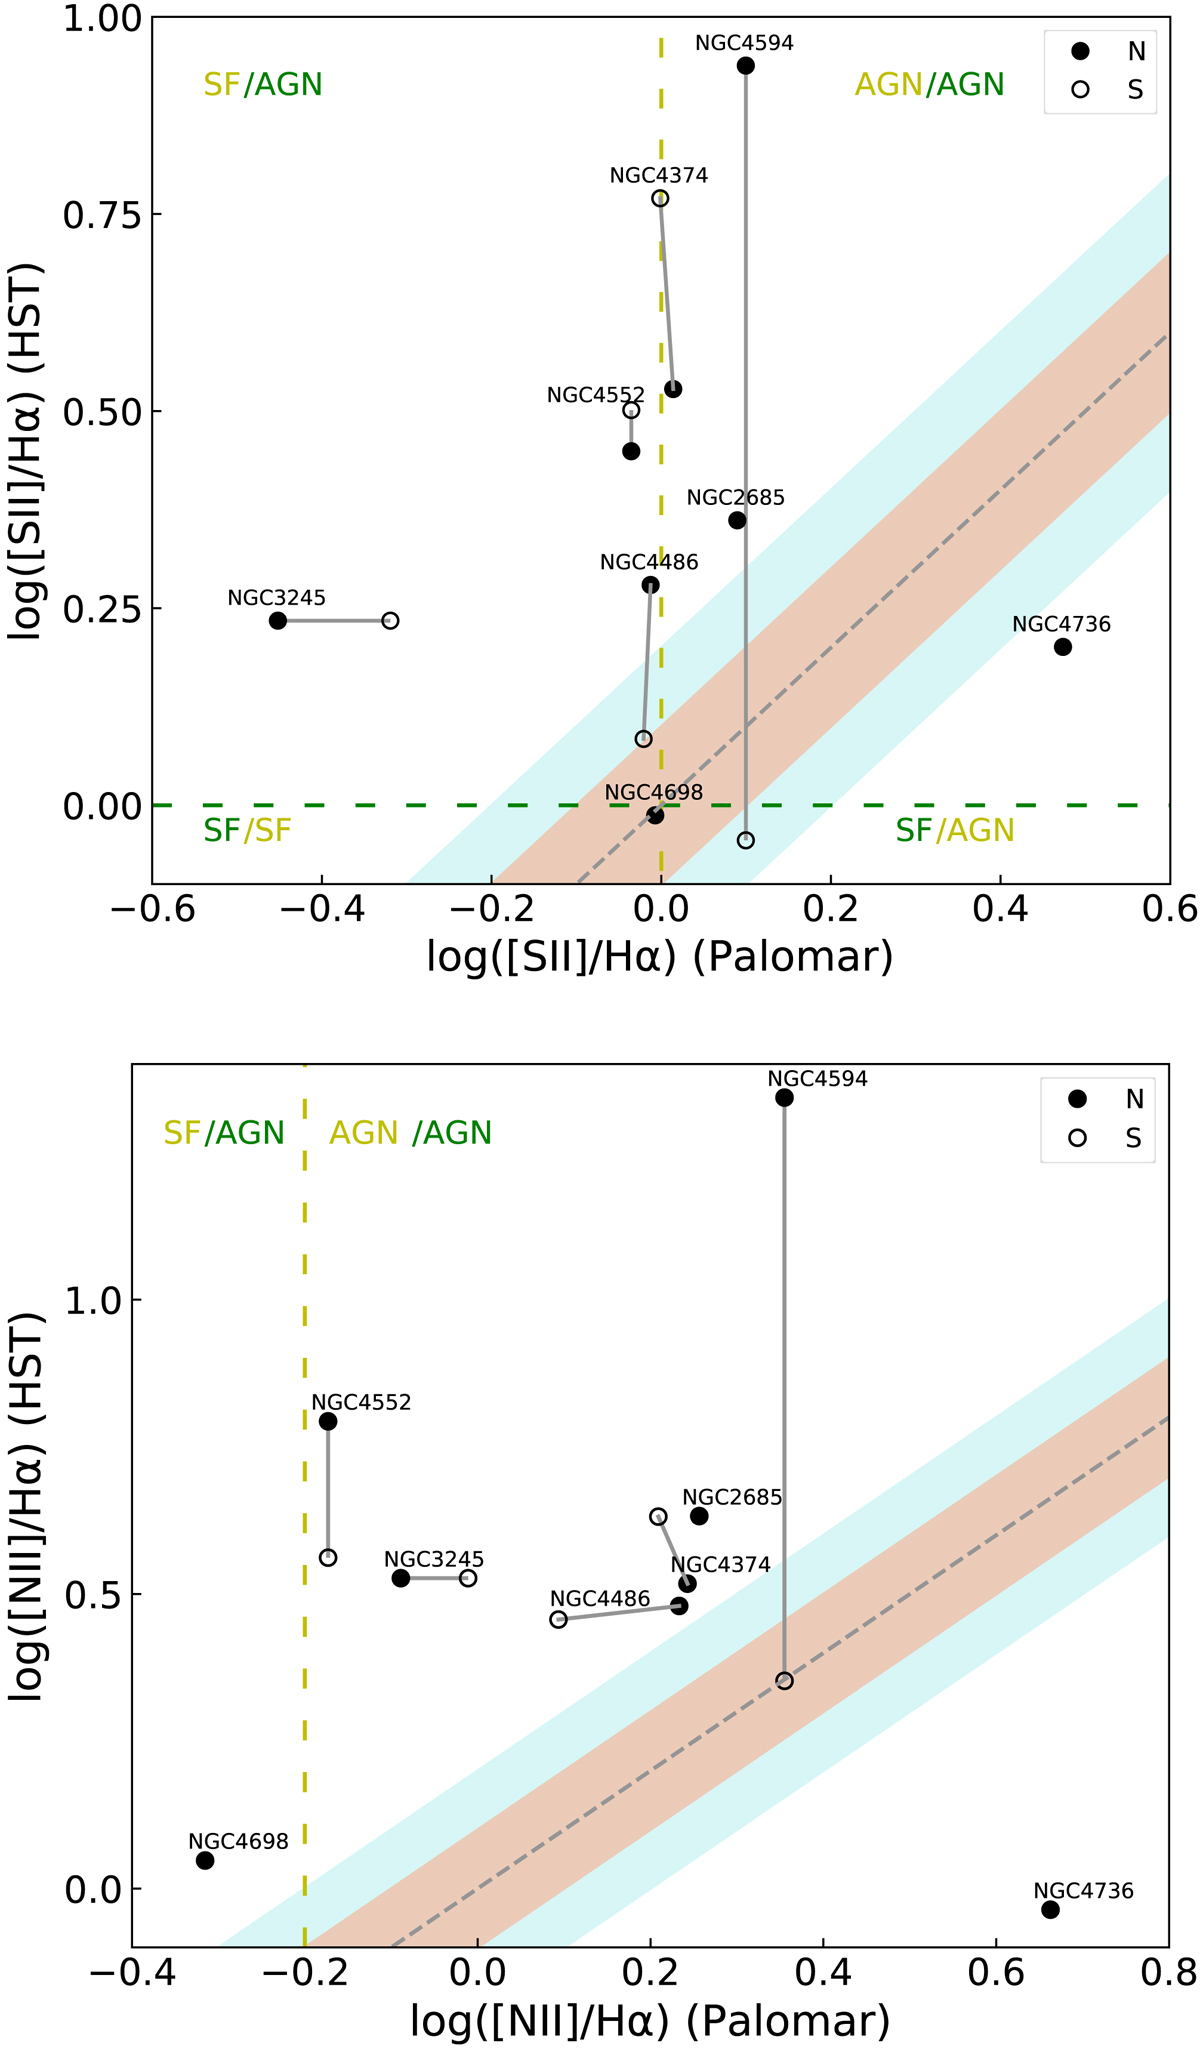
Comparison of line ratios for [S II]/Hα (top) and [N II]/Hα (bottom) for both HST/STIS spectra (y-axis) and Palomar spectra (x-axis). The gray dashed line is the one-to-one comparison. Filled circles represent the narrow component, whereas the empty circles are for the secondary, which is connected to the narrow through a gray solid line when present. The light pink and light blue ranges indicate the 10% and 20% uncertainty levels with respect to the one-to-one comparison, respectively. Green and yellow dashed lines indicate the limits (HST and Palomar, respectively) for the star forming (SF) and AGN regions. The limits were obtained from Kauffmann et al. (2003) and Kewley et al. (2006).
Current usage metrics show cumulative count of Article Views (full-text article views including HTML views, PDF and ePub downloads, according to the available data) and Abstracts Views on Vision4Press platform.
Data correspond to usage on the plateform after 2015. The current usage metrics is available 48-96 hours after online publication and is updated daily on week days.
Initial download of the metrics may take a while.