Fig. B.9.
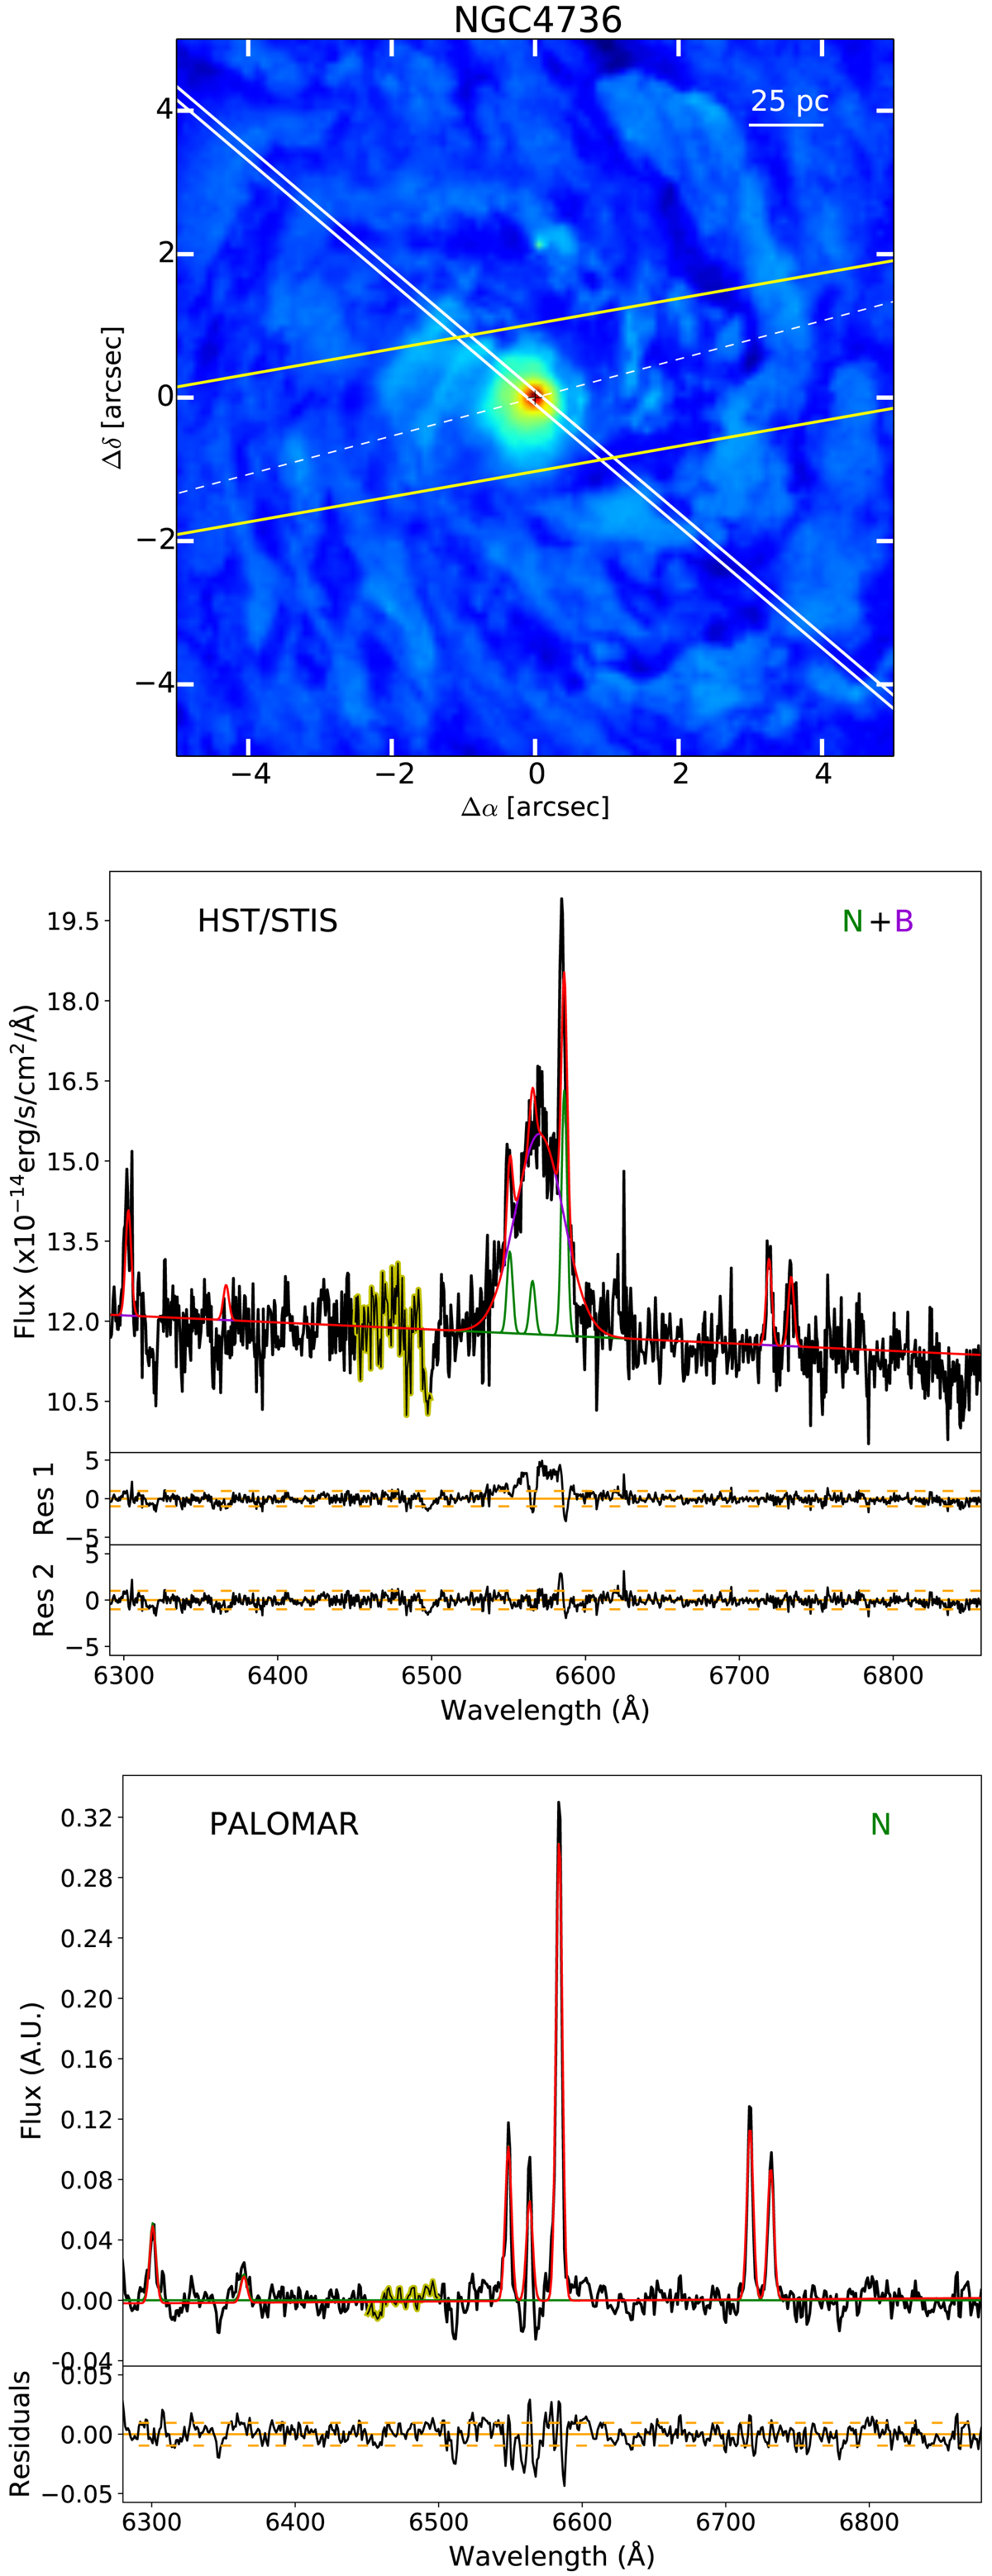
See text for a general description of the figure. NGC 4736: both [S II] and [O I] lines are unblended in the HST/STIS spectrum and they clearly present narrow profiles. In the Hα − [N II] lines a broad component is visible, as already reported by Constantin et al. (2015). For the Palomar spectrum, a narrow component is sufficient for fitting all the emission lines considered in our study.
Current usage metrics show cumulative count of Article Views (full-text article views including HTML views, PDF and ePub downloads, according to the available data) and Abstracts Views on Vision4Press platform.
Data correspond to usage on the plateform after 2015. The current usage metrics is available 48-96 hours after online publication and is updated daily on week days.
Initial download of the metrics may take a while.