Fig. 2.
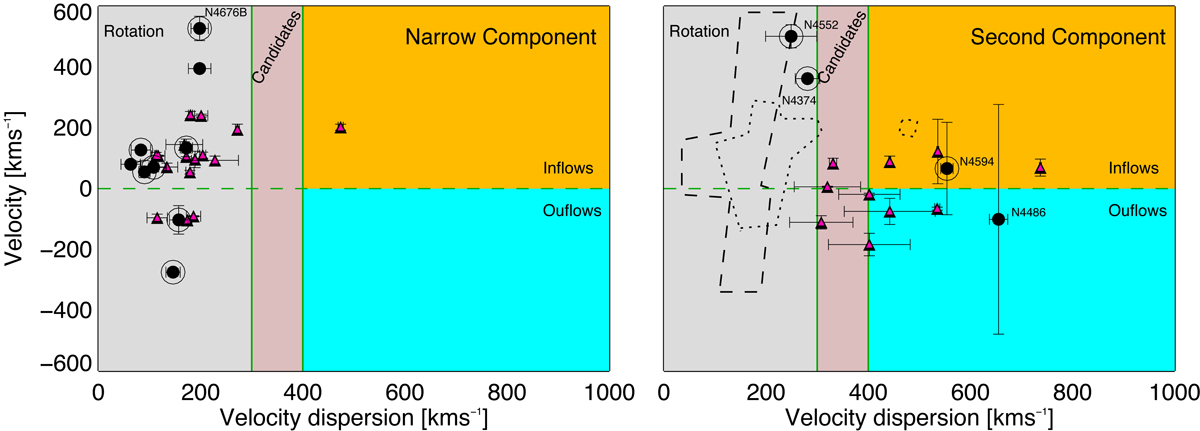
Velocity dispersion vs. velocity derived for narrow (left panel) and secondary (right panel) components used to model the HST/STIS spectra for both type 1.9 from C18 (red triangles) and type 2 (black filled circles) LINERs. An additional black circle marks those cases for which a broad component is needed in HST/STIS spectra. All type 1.9 LINERs from C18 show a broad component. Each of the marked regions indicates to which kinematic component the modeled component can be associated. The orange region indicates inflows, the blue region indicates outflows, the pink region indicates candidates for both inflows and outflows, and the gray region indicates rotation. On the right panel, the contours of the narrow components are shown for both type 1.9 (dotted lines) and type 2 (dashed lines) LINERs.
Current usage metrics show cumulative count of Article Views (full-text article views including HTML views, PDF and ePub downloads, according to the available data) and Abstracts Views on Vision4Press platform.
Data correspond to usage on the plateform after 2015. The current usage metrics is available 48-96 hours after online publication and is updated daily on week days.
Initial download of the metrics may take a while.