Fig. B.3.
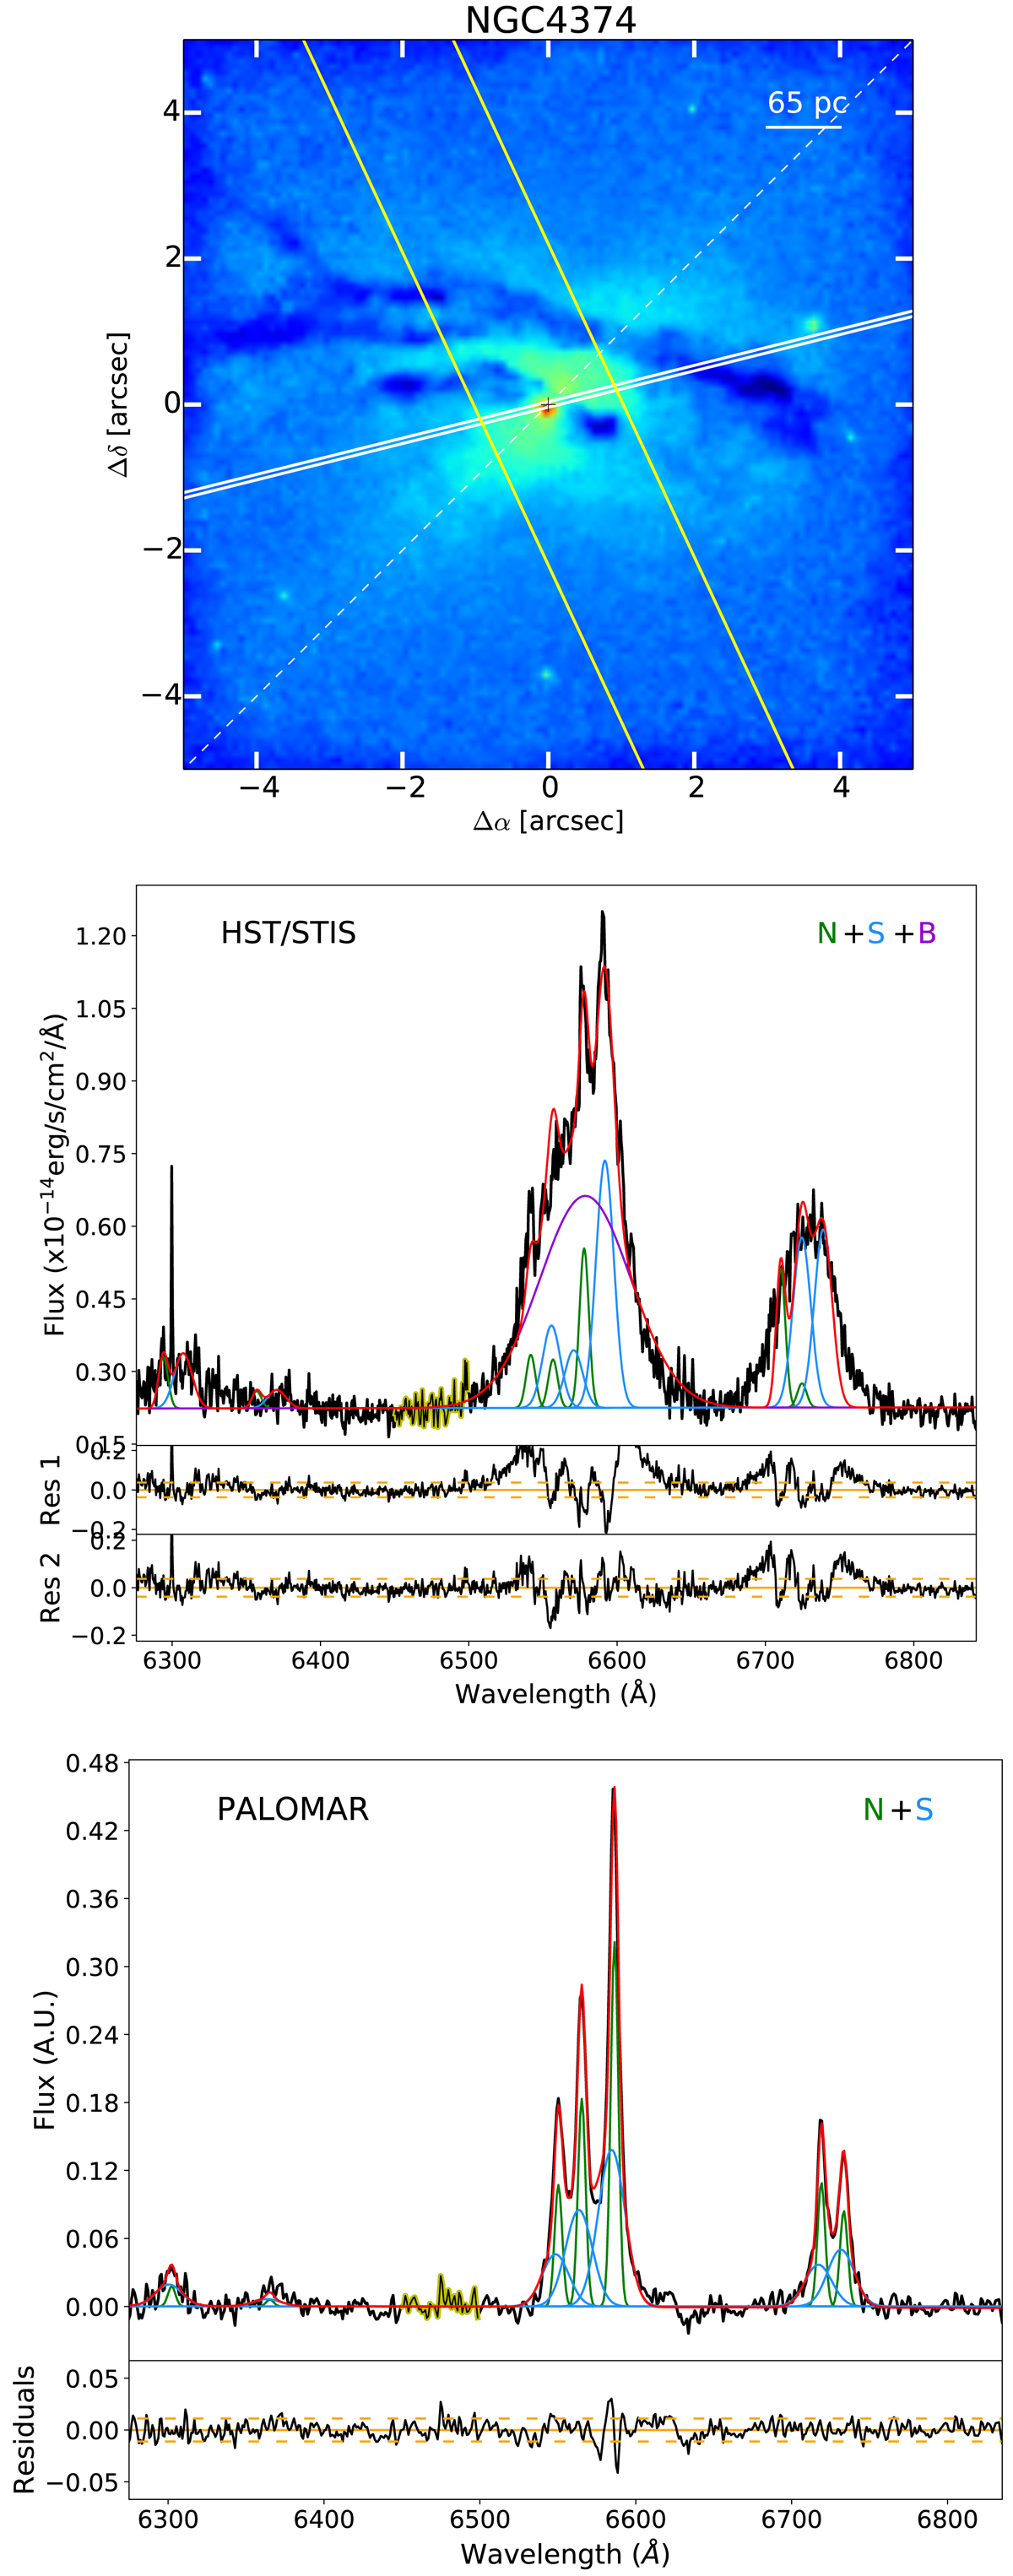
See text for a general description of the figure. NGC 4374: in the HST/STIS spectrum, [S II] lines are severely blended, and only the [O I]λ6300 Å line is visible (with low S/N). This complicated the modeling for the other lines, so the fit was performed considering the narrow peaks of [N II]−Hα blend (see Sect. 3), which results in high residuals under the [S II] lines. A broad component is needed in this decomposition. For the Palomar spectrum, all the emission lines are well-modeled with two Gaussian components.
Current usage metrics show cumulative count of Article Views (full-text article views including HTML views, PDF and ePub downloads, according to the available data) and Abstracts Views on Vision4Press platform.
Data correspond to usage on the plateform after 2015. The current usage metrics is available 48-96 hours after online publication and is updated daily on week days.
Initial download of the metrics may take a while.