Fig. 8.
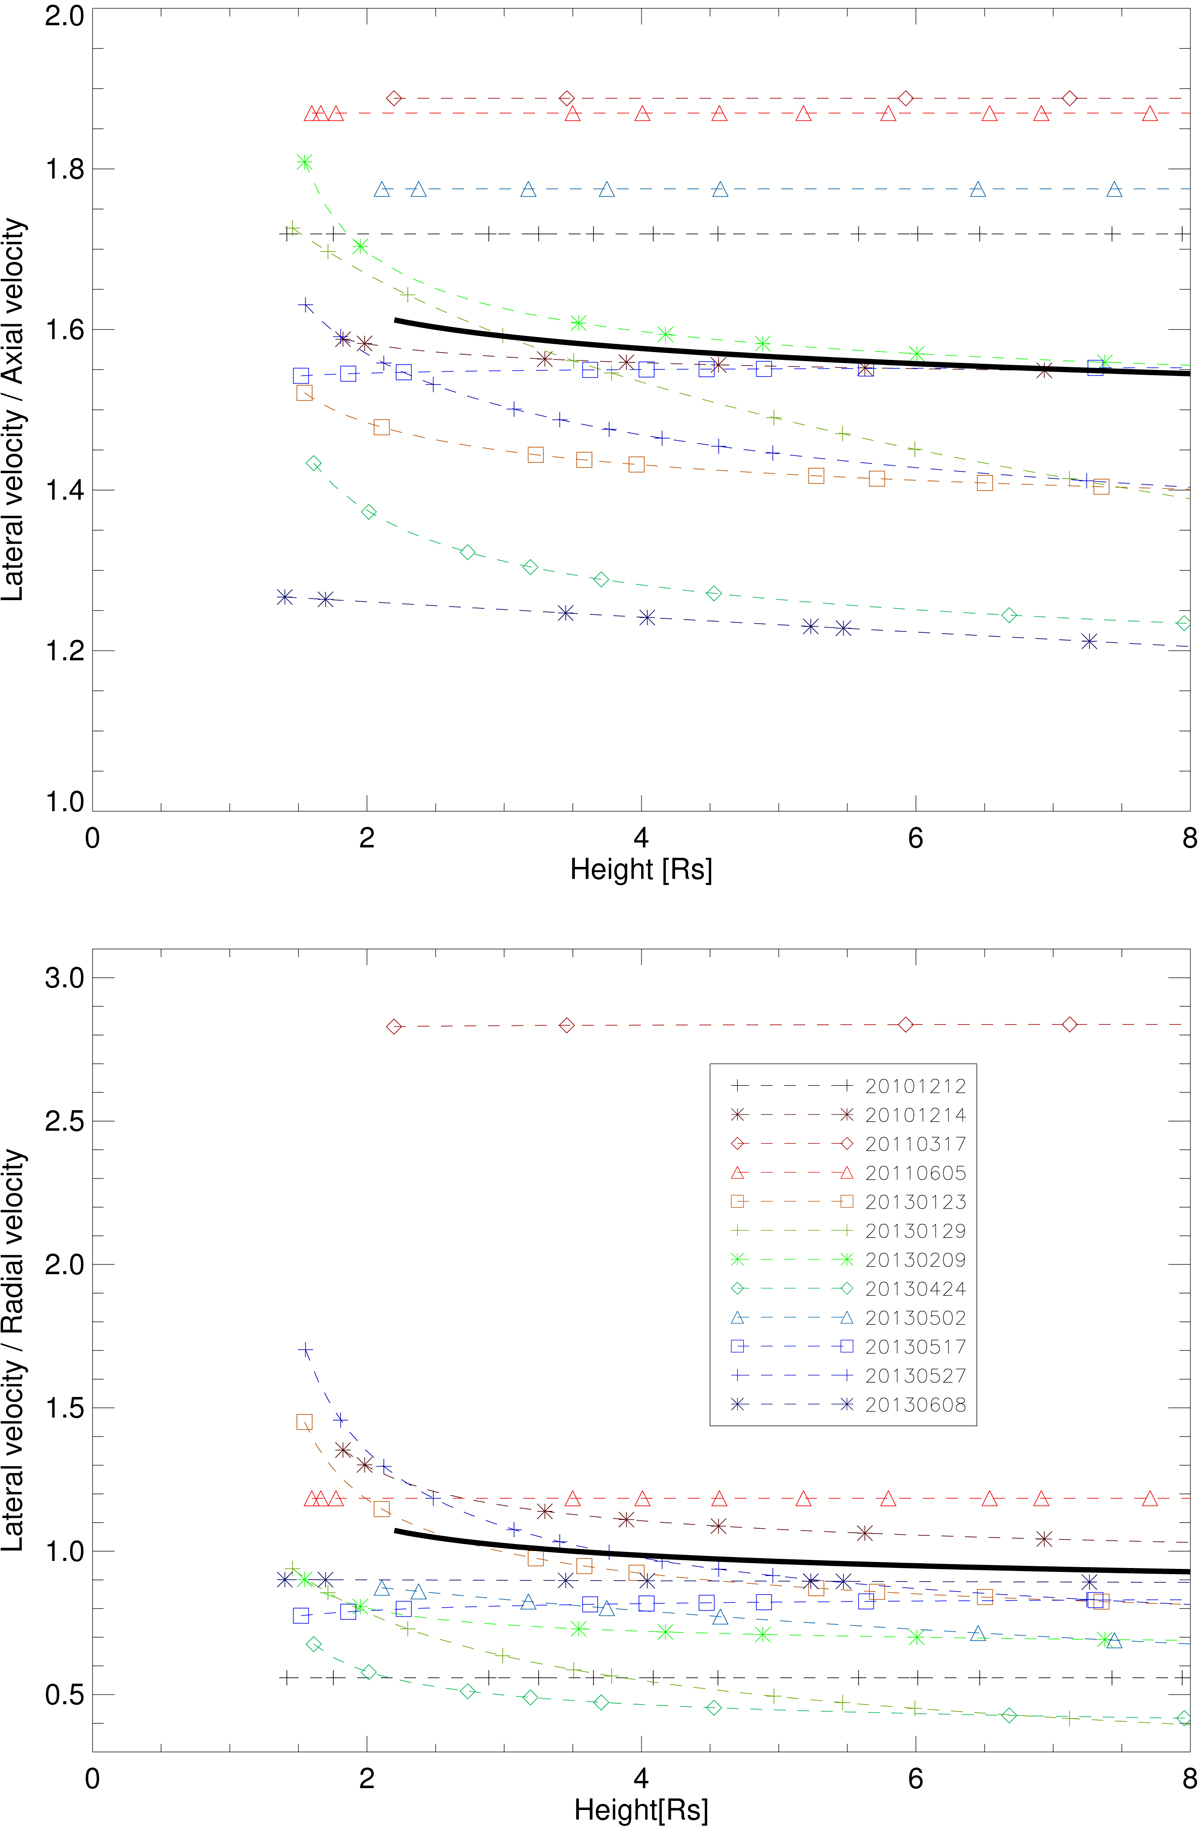
Speed ratios as a function of height. Top panel: lateral to axial speed. Bottom panel: lateral to radial (propagation) speed. The dashed colored lines correspond to individual events (see legend in bottom panel), which also applies to the top plot. The black solid line is their average, starting at the first height where all events could be measured.
Current usage metrics show cumulative count of Article Views (full-text article views including HTML views, PDF and ePub downloads, according to the available data) and Abstracts Views on Vision4Press platform.
Data correspond to usage on the plateform after 2015. The current usage metrics is available 48-96 hours after online publication and is updated daily on week days.
Initial download of the metrics may take a while.